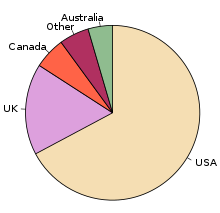
 英語
話者의 人口 數를 圓그래프로 나타낸 모습.
英語
話者의 人口 數를 圓그래프로 나타낸 모습.
圓그래프
(
英語
:
Pie chart
)는 全體에 對한 各 部分의 比率을 부채꼴 模樣으로
百分率
로 나타낸 그래프이다. 各 부채꼴의 中心角이 全體에서 차지하는 比率을 나타내며, 比率을 한눈에 볼 수 있다는 長點이 있다. 全體的인 比率을 쉽게 把握할 수 있어서 言論社에서 統計 數値를 公開할 때 자주 活用된다. 最初의 원그래프는
윌리엄 플레이페어
의 1801年 Statistical Breviary이다.
[1]
[2]
원그래프는 비즈니스界와 大衆 媒體에 매우 널리 使用된다.
[3]
그러나 批評 또한 存在하는데,
[4]
수많은 專門家들은 이들을 使用하는 것을 삼갈 것을 勸告하면서,
[5]
[6]
[7]
[8]
硏究에 따르면 주어진 圓그래프의 各其 다른 部分을 比較한다든지 圓그래프 간 데이터를 比較하는 일이 어려움이 立證되었다는 것을 指摘하였다. 원그래프는 大部分의 境遇
막대그래프
,
箱子 鬚髥 그림
,
點 圖表
等 다른 플롯으로 代替가 可能하다.
作成 方法
[
編輯
]
원그래프는 數値데이터를 表現한다. 먼저 全體에 對한 各 項目의 百分率을 計算한다. 그 다음 項目이 차지하는 百分率만큼 圓을 나눈다. 마지막으로 各 項目의 名稱, 百分率을 적는다. 圓그래프를 나누어 나온 百分率의 合이 100%가 되는지 確認해야 한다.
例를 들어 1 圓그래프에서 全體를 40等分 한 것 中 5칸 을 차지하는 것을 全體의 길이가 36cm인 띠그래프로 그리면 몇 cm로 나타나는가 하면 全體를 20等分한 圓그래프에서 5칸을 차지한다는 것은 그것이 全體의 5/20, 卽 1/4을 차지한다는 것이다. 1/4 = 25/100 이므로 全體의 25%를 차지하게 된다.
같이 보기
[
編輯
]
各州
[
編輯
]
外部 링크
[
編輯
]
 위키미디어 公用에
圓그래프
關聯 미디어 分類가 있습니다.
위키미디어 公用에
圓그래프
關聯 미디어 分類가 있습니다.
參考 文獻
[
編輯
]
- Cleveland, William S. (1985). 《The Elements of Graphing Data》. Pacific Grove, CA: Wadsworth & Advanced Book Program.
ISBN
0-534-03730-5
.
- Friendly, Michael
. "
The Golden Age of Statistical Graphics
,"
Statistical Science,
Volume 23, Number 4 (2008), 502-535
- Good, Phillip I.
and Hardin, James W.
Common Errors in Statistics (and How to Avoid Them)
. Wiley. 2003.
ISBN
0-471-46068-0
.
- Guerry, A.-M. (1829). Tableau des variations meteorologique comparees aux phenomenes physiologiques, d'apres les observations faites a l'obervatoire royal, et les recherches statistique les plus recentes.
Annales d'Hygiene Publique et de Medecine Legale
, 1 :228-.
- Harris, Robert L. (1999). 《Information Graphics: A comprehensive Illustrated Reference》.
Oxford University Press
.
ISBN
0-19-513532-6
.
- Lima, Manuel
. "
Why humans love pie charts: an historical and evolutionary perspective
,"
Noteworthy
, July 23, 2018
- Palsky Gilles
.
Des chiffres et des cartes: la cartographie quantitative au XIXe siecle
. Paris: Comite des travaux historiques et scientifiques, 1996.
ISBN
2-7355-0336-4
.
- Playfair, William,
Commercial and Political Atlas and Statistical Breviary
,
Cambridge University Press
(2005)
ISBN
0-521-85554-3
.
- Spence, Ian
.
No Humble Pie: The Origins and Usage of a statistical Chart
.
Journal of Educational and Behavioral Statistics
. Winter 2005, 30 (4), 353?368.
- Tufte, Edward
.
The Visual Display of Quantitative Information
. Graphics Press, 2001.
ISBN
0-9613921-4-2
.
- Van Belle, Gerald.
Statistical Rules of Thumb
. Wiley, 2002.
ISBN
0-471-40227-3
.
- Wilkinson, Leland
.
The Grammar of Graphics
, 2nd edition. Springer, 2005.
ISBN
0-387-24544-8
.
