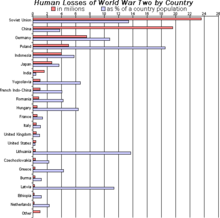
 막대 그래프의 예
막대 그래프
(-graph),
바 차트
(bar chart),
바 그래프
(bar graph)는 表現 값에 比例하여
높이
와
길이
를 지닌
直四角形
막대로
範疇型 데이터
를 表現하는 차트나 그래프를 말한다. 막대는 垂直으로나 水平으로 그릴 수 있다. 垂直 막대 그래프는
선 그래프
또는
라인 그래프
(line graph)라고도 한다.
歷史
[
編輯
]
수많은 出處에 따르면
윌리엄 플레이페어
(1759-1824年)가 막대 그래프를 發明한 것으로 看做하며, 그의 商業政治도해(The Commercial and Political Atlas)의 크리스마스 1780年부터 크리스마스 1781年 사이 1年 間 스코틀랜드와 여러 地域 間 輸出入(Exports and Imports of Scotland to and from different parts for one Year from Christmas 1780 to Christmas 1781) 그래프가 歷史上 最初의 막대 그래프로 看做된다.
約 300年 前 The Latitude of Forms에 出刊된 時間에 따라 꾸준히 加速하는 物體의 速度 다이어그램(Jacobus de Sancto Martino 또는
니콜 오렘
)
[1]
은 "原始的 막대 그래프"로 解釋될 수 있다.
[2]
[3]
같이 보기
[
編輯
]
各州
[
編輯
]
- ↑
Clagett, Marshall
(1968), 《Nicole Oresme and the Medieval Geometry of Qualities and Motions》, Madison: Univ. of Wisconsin Press, 85?99쪽,
ISBN
0-299-04880-2
- ↑
Beniger, James R.
; Robyn, Dorothy L. (1978), “Quantitative Graphics in Statistics: A Brief History”, 《The American Statistician》 (Taylor & Francis, Ltd.)
32
(1): 1?11,
doi
:
10.1080/00031305.1978.10479235
,
JSTOR
2683467
- ↑
Der, Geoff; Everitt, Brian S. (2014).
《A Handbook of Statistical Graphics Using SAS ODS》
. Chapman and Hall - CRC.
ISBN
1-584-88784-2
.
外部 링크
[
編輯
]
