Here are
218 public repositories
matching this topic...
Data Apps & Dashboards for Python. No JavaScript Required.
-
Updated
May 15, 2024
-
Python
The best JavaScript Data Table for building Enterprise Applications. Supports React / Angular / Vue / Plain JavaScript.
-
Updated
May 20, 2024
-
TypeScript
Performant financial charts built with HTML5 canvas
-
Updated
May 17, 2024
-
TypeScript
Multi-Dimensional charting built to work natively with crossfilter rendered with d3.js
-
Updated
Apr 24, 2024
-
JavaScript

Interactive plotting library for .NET

A charting and data visualization library for Unity. Unity?据可?化?表?件。
AnyChart Android Chart is an amazing data visualization library for easily creating interactive charts in Android apps. It runs on API 19+ (Android 4.4) and features dozens of built-in chart types.
-
Updated
Jul 28, 2023
-
Java

Instant offline SQL-powered data visualisation in your browser
-
Updated
Jan 7, 2024
-
JavaScript
Library for animated data visualizations and data stories.
-
Updated
May 17, 2024
-
JavaScript
Nice-looking lightweight console ASCII line charts ??? for NodeJS, browsers and terminal, no dependencies
-
Updated
Mar 28, 2024
-
Python
Querybook is a Big Data Querying UI, combining collocated table metadata and a simple notebook interface.
-
Updated
May 17, 2024
-
TypeScript
The most advanced amCharts charting library for JavaScript and TypeScript apps.
-
Updated
Aug 21, 2023
-
TypeScript
JSXGraph is a cross-browser library for interactive geometry, function plotting, charting, and data visualization in a web browser.
-
Updated
May 19, 2024
-
JavaScript
Build animated charts in Jupyter Notebook and similar environments with a simple Python syntax.
-
Updated
Apr 29, 2024
-
Jupyter Notebook
Quantitative Financial Modelling Framework
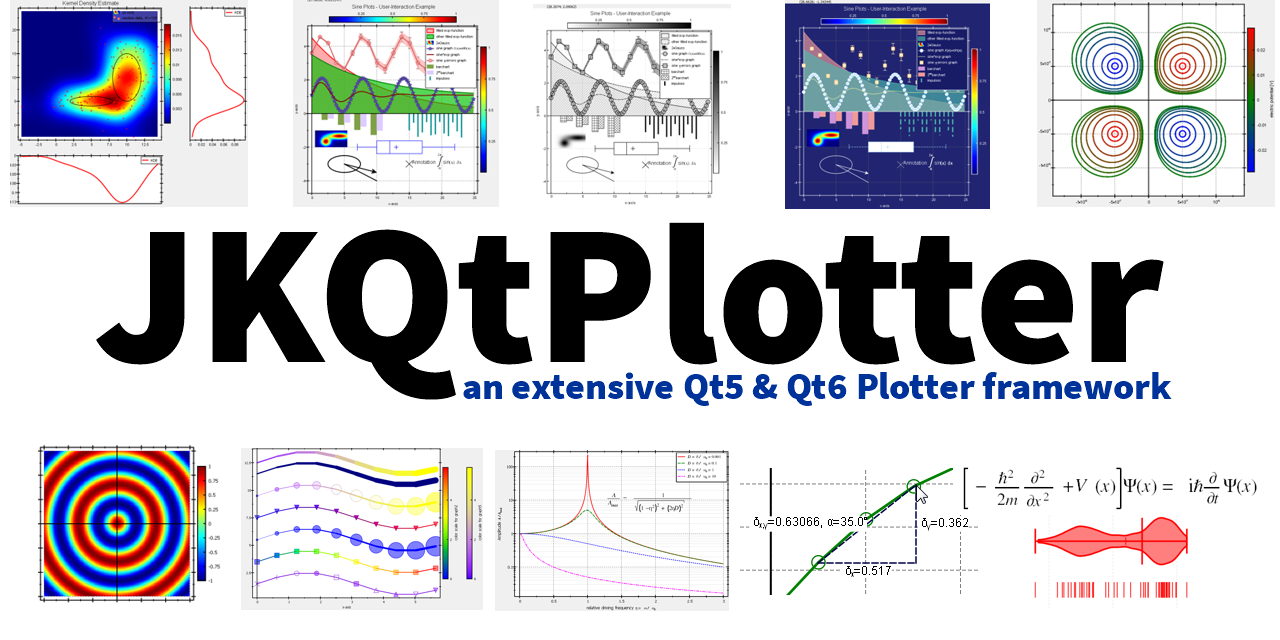
an extensive Qt5 & Qt6 Plotter framework (including a feature-richt plotter widget, a speed-optimized, but limited variant and a LaTeX equation renderer!), written fully in C/C++ and without external dependencies
Dash for Julia - A Julia interface to the Dash ecosystem for creating analytic web applications in Julia. No JavaScript required.
-
Updated
May 3, 2024
-
Julia
Technical Indicators implemented in Python using Pandas
-
Updated
Oct 25, 2019
-
Python
Reporting engine for Django, Create dashboards, reports and charts effectively and effortlessly.
-
Updated
Jan 16, 2024
-
Python
Animated radial and pie charts for Flutter
-
Updated
Oct 27, 2021
-
Dart
Improve this page
Add a description, image, and links to the
charting
topic page so that developers can more easily learn about it.
Curate this topic
Add this topic to your repo
To associate your repository with the
charting
topic, visit your repo's landing page and select "manage topics."
Learn more
You can’t perform that action at this time.
