Here are
124 public repositories
matching this topic...
-
Updated
Apr 6, 2022
-
Jupyter Notebook
A day to day plan for this challenge. Covers both theoritical and practical aspects
-
Updated
Feb 6, 2023
-
Jupyter Notebook
The guide to master Artificial Intelligence (machine learning & deep learning) from beginner to advance
Not only automatic, but also intelligent. An Intelligent data Visualization System, based on LLM.
-
Updated
May 24, 2024
-
TypeScript
Webstranka ve?ejnych infografik o zm?n? klimatu sv?ta
-
Updated
May 24, 2024
-
HTML
A large-scale curated dataset of Visual.ly infographics with metadata and additional crowdsourced annotations for research applications in computer vision and natural language processing.
-
Updated
Feb 4, 2019
-
Jupyter Notebook
Create an infographic based on your Netflix viewing habits
-
Updated
Aug 16, 2018
-
Java
Explore fascinating TidyTuesday projects in my portfolio, showcasing data visualization and analysis skills.
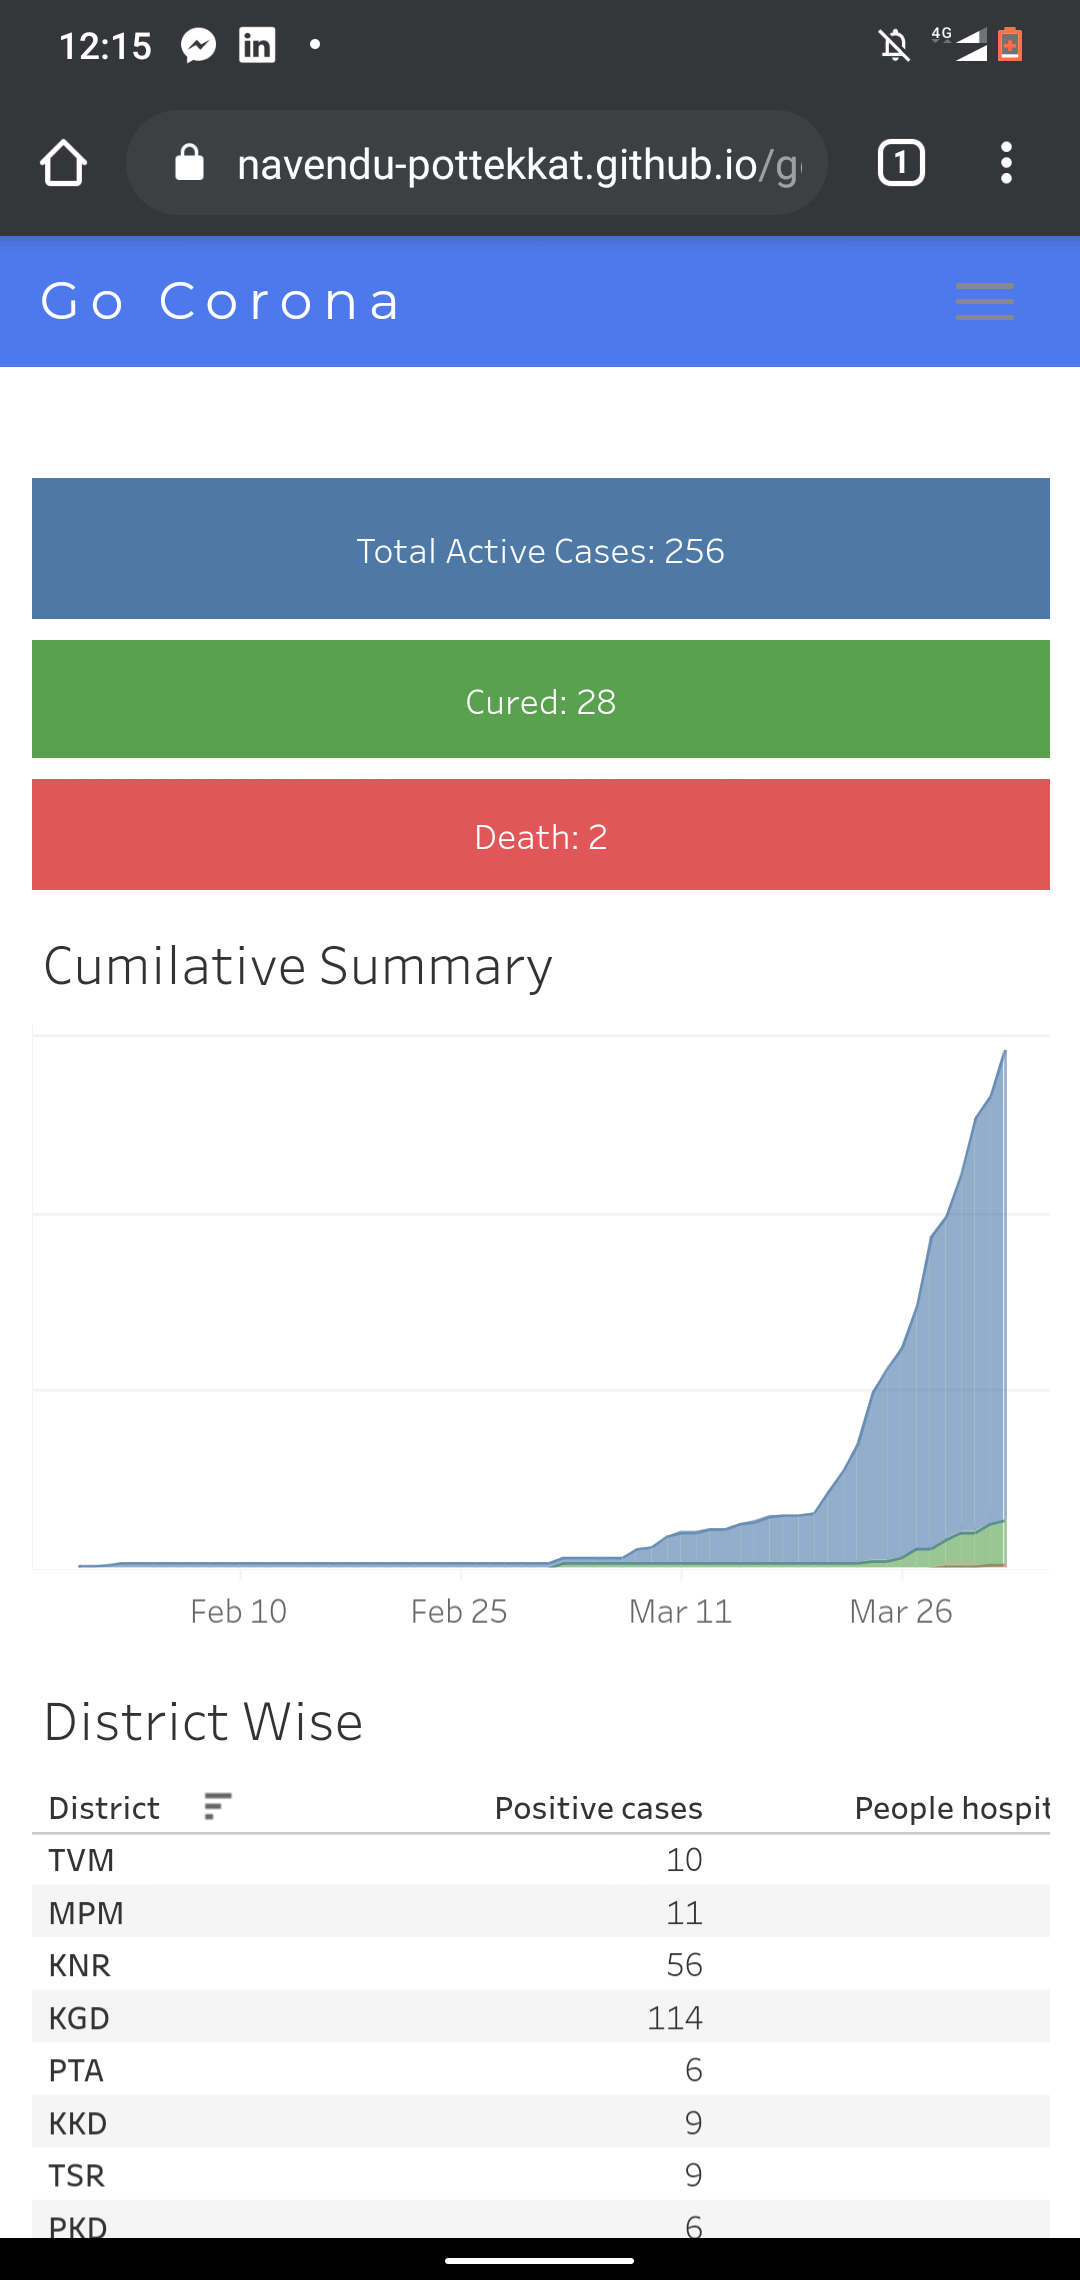
Live viz and updates of COVID 19. Let us fight this together!
-
Updated
Apr 19, 2020
-
HTML
a number of Svelte infographics

SZEKELYDATA | Erdely, Szekelyfold es a nagyvilag a Big Data korszakaban
-
Updated
May 30, 2024
-
Jupyter Notebook
data statistics from professionals
-
Updated
Oct 18, 2020
-
HTML
Infographiq, ie intelligent interactive infographics, core JavaScript library
-
Updated
Jan 17, 2024
-
HTML
ASP.NET Core MVC samples for Dashboards.WEB embedded data analysis tool, Visual Studio C# solution, and .NET Core 3.1, .NET 5.0, .NET 6.0, .NET 7.0 dashboard engine
This is a repository where you will find my contributions to the #30DayChartChallenge, a competition that takes place every year in April.
-
Updated
Jan 9, 2024
-
JavaScript
A Geovisual Analytical Framework
-
Updated
Aug 30, 2018
-
JavaScript
Web pages for educational purposes: learning HTML, CSS, JS, Python, PHP
-
Updated
May 24, 2024
-
HTML
Promover a conscientizacao dos eleitores para o voto consciente, a partir de comparacoes dos perfis politicos para as eleicoes de 2018, bem como compartilhamento destes comparativos nas redes sociais e apps de comunicacao (WatsApp, Telegram...)
Improve this page
Add a description, image, and links to the
infographics
topic page so that developers can more easily learn about it.
Curate this topic
Add this topic to your repo
To associate your repository with the
infographics
topic, visit your repo's landing page and select "manage topics."
Learn more
You can’t perform that action at this time.
