In
statistics
, a
confidence interval
, abbreviated as CI,
[1]
is a tool that people use when they collect
data
in order to
estimate
a certain
parameter
, such as the
mean
(average) of a population.
[2]
A confidence interval gives a range of values that tells others how good we think our estimate is.
Each confidence interval depends on certain properties of the sample(s) that we use to make it. For example, a confidence interval that is made from a sample of 5000 people is going to be much better than a confidence interval made from a sample of only 5 people.
We usually give confidence intervals as a
percentage
, such as 95%. These percentages are called
confidence levels.
Meaning of the term "confidence"
[
change
|
change source
]
The term
confidence
has a similar meaning in statistics, as in common use. In common usage, a claim to 95% confidence in something is normally taken as indicating near
certainty
. In statistics, a claim to 95% confidence simply means that the researcher has seen one possible interval from a large number of possible ones, from which 19 out of 20 intervals contain the true value of the parameter.
 A factory assembly line fills margarine cups to a desired 250g +/- 5g
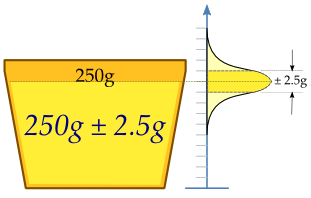
A machine fills cups with
margarine
. It is adjusted so that the content of the cups is 250g of margarine. As the machine cannot fill every cup with exactly 250g, the content added to individual cups shows some variation, and is considered a
random variable
X.
This variation is assumed to be
normally distributed
around the desired average of 250g, with a
standard deviation
of 2.5g. To check if the machine is adequately
calibrated
, a sample of
n
= 25 cups of margarine is chosen at random, and the cups are weighed. The weights of margarine are
X
1
, ...,
X
25
, a random sample from
X
.
To get an impression of the expectation μ, an estimate is needed. The appropriate
estimator
is the sample
mean
:

The sample shows actual weights
x
1
, ...,
x
25
, with mean:

If we take another sample of 25 cups, we could easily expect to find values like 250.4 or 251.1 grams. A sample mean value of 280 grams, however, would be extremely rare if the mean content of the cups is in fact close to 250g.
There is a whole
interval
around the observed value 250.2 of the sample mean within which, if the whole population mean actually takes a value in this range, the observed data would not be considered particularly unusual. Such an interval is called a confidence interval for the parameter
μ
.
To calculate such an interval, the endpoints of the interval have to be calculated from the sample, so they are statistics, functions of the sample
X
1
, ...,
X
25
, and hence are random variables themselves.
In our case, we may determine the endpoints by considering that the sample mean
X
from a normally distributed sample is also normally distributed, with the same expectation
μ
, but with standard error
σ
/√
n
= 0.5 (grams). By standardizing, we get a random variable

which depends on the parameter μ to be estimated, but with a standard normal distribution independent of the parameter
μ
. Hence it is possible to find numbers ?
z
and
z
, independent of
μ
, where
Z
lies in between with probability 1 ? α, a measure of how confident we want to be. We take 1 - α = 0.95. So we have:

The number
z
follows from the
cumulative distribution function
:
![{\displaystyle {\begin{aligned}\Phi (z)&=P(Z\leq z)=1-{\tfrac {\alpha }{2}}=0.975,\\[6pt]z&=\Phi ^{-1}(\Phi (z))=\Phi ^{-1}(0.975)=1.96,\end{aligned}}}](https://wikimedia.org/api/rest_v1/media/math/render/svg/0e80e68d525d87d1b722d1150abda18cecb8f684)
and we get:
![{\displaystyle {\begin{aligned}0.95&=1-\alpha =P(-z\leq Z\leq z)=P\left(-1.96\leq {\frac {{\bar {X}}-\mu }{\sigma /{\sqrt {n}}}}\leq 1.96\right)\\[6pt]&=P\left({\bar {X}}-1.96{\frac {\sigma }{\sqrt {n}}}\leq \mu \leq {\bar {X}}+1.96{\frac {\sigma }{\sqrt {n}}}\right)\\[6pt]&=P\left({\bar {X}}-1.96\times 0.5\leq \mu \leq {\bar {X}}+1.96\times 0.5\right)\\[6pt]&=P\left({\bar {X}}-0.98\leq \mu \leq {\bar {X}}+0.98\right).\end{aligned}}}](https://wikimedia.org/api/rest_v1/media/math/render/svg/2437ee6c7c0320fa30cec1de64773a6e7cc3a095)
This might be interpreted as: with probability 0.95, we will find a confidence interval in which we will meet the parameter
μ
between the
stochastic
endpoints

and

This does not mean that there is 0.95 probability of meeting the parameter μ in the calculated interval. Every time the measurements are repeated, there will be another value for the mean
X
of the sample. In 95% of the cases,
μ
will be between the endpoints calculated from this mean, but in 5% of the cases, it will not be. The actual confidence interval is calculated by entering the measured weights in the formula. Our 0.95 confidence interval becomes:

 The vertical
line segments
represent 50 realisations of a confidence interval for μ.
The vertical
line segments
represent 50 realisations of a confidence interval for μ.
As the desired value 250 of
μ
is within the resulted confidence interval, there is no reason to believe the machine is wrongly calibrated.
The calculated interval has fixed endpoints, where μ might be in between (or not). Thus this event has probability either 0 or 1. We
cannot
say: "with probability (1 ? α), the parameter
μ
lies in the confidence interval." We only know that by repetition in 100(1 ? α) % of the cases, μ will be in the calculated interval. In 100α % of the cases, however, it does not. And unfortunately we do not know in which of the cases this happens. That is why we say: "with confidence level 100(1 ? α) %,
μ
lies in the confidence interval."
The figure on the right shows 50 realisations of a confidence interval for a given population mean μ. If we randomly choose one realisation, the probability that it contains the parameter is 95%. However, it is also possible that we may have unluckily picked the wrong one as well.
- ↑
"List of Probability and Statistics Symbols"
.
Math Vault
. 2020-04-26
. Retrieved
2020-10-14
.
- ↑
"Confidence Intervals"
.
www.stat.yale.edu
. Retrieved
2020-10-14
.