Overview of the transport in Australia
 A map of major roads in Australia. Roads are the main method of transport in Australia.
There are many forms of
transport in Australia
. Australia is highly dependent on
road transport
. There are more than
300 airports
with paved runways. Passenger rail transport includes widespread commuter networks in the major capital cities with more limited intercity and interstate networks. The
Australian mining sector
is reliant upon rail to transport its product to Australia's ports for export.
Road transport
[
edit
]
 Eastern Freeway, Melbourne
Road transport is an essential element of the Australian transport network, and an enabler of the
Australian economy
. There is a heavy reliance on road transport due to Australia's large area and low
population density
in considerable parts of the country.
[1]
Australia's road network experiences excessive demand during peak periods and very weak demand overnight.
[2]
Another reason for the reliance upon roads is that the
Australian rail network
has not been sufficiently developed for a lot of the freight and passenger requirements in most areas of Australia. This has meant that
goods
that would otherwise be transported by rail are moved across Australia via
road trains
. Almost every household owns at least one
car
, and uses it most days.
[3]
There are three different categories of Australian roads. They are federal highways, state highways and local roads. The road network comprises a total of 913,000 km broken down into:
[4]
- paved: 353,331 km (including 3,132 km of expressways)
- unpaved: 559,669 km (1996 estimate)
Victoria
has the largest network, with thousands of arterial (major, primary and secondary) roads to add.
The majority of road tunnels in Australia have been constructed since the 1990s to relieve traffic congestion in metropolitan areas, or to cross significant watercourses.
Cars
[
edit
]
Australia has the thirteenth-highest level of
car ownership
in the world. It has three to four times more road per capita than Europe and seven to nine times more than Asia. Australia also has the third-highest per capita rate of fuel consumption in the world.
Melbourne
is the most car-dependent city in Australia, according to a data survey in the 2010s, having over 110,000 more cars driving to and from the city each day than
Sydney
.
Perth
,
Adelaide
and
Brisbane
are rated as being close behind. All these capital cities are rated among the highest in this category in the world (
car dependency
).
[5]
The distance travelled by car (or similar vehicle) in Australia is among the highest in the world.
[1]
Electric vehicles
[
edit
]
The adoption of
plug-in electric vehicles
in Australia is driven mostly by state-based
electric vehicle
targets and monetary incentives to support the adoption and deployment of low- or
zero-emission vehicles
. The monetary incentives include electric vehicle subsidies, interest-free loans, registration exemptions,
stamp duty
exemptions, the
luxury car tax
exemption and discounted parking for both private and commercial purchases. The
Victorian
and
New South Wales
governments target between 50% and 53% of new car sales to be electric vehicles by 2030.
[6]
[7]
[8]
Public transport in Australia
[
edit
]
 Commuter train in
Melbourne
Commuter train in
Melbourne
 Alstom Citadis
and
Bombardier Flexity Classic
trams in
Adelaide
Alstom Citadis
and
Bombardier Flexity Classic
trams in
Adelaide
 A driverless
Alstom Metropolis
train on the
Sydney Metro
network
A driverless
Alstom Metropolis
train on the
Sydney Metro
network
Suburban rail
[
edit
]
Sydney, Melbourne, Brisbane, Perth and Adelaide have extensive suburban rail networks which have grown and expanded over time. Australian suburban rail typically operates with bidirectional all-day services with Sydney, Melbourne, and to a lesser extent Perth and Brisbane's systems operating with much higher frequencies, particularly in their underground cores.
Sydney Trains
operates the busiest system in the country with approximately 1 million trips per day.
Metro Trains Melbourne
operates a larger system albeit with a lower number of trips.
Trams and light rail
[
edit
]
Trams
have historically operated in many Australian towns and cities, with the majority of these being shut down before the 1970s in the belief that more widespread car ownership would render them unnecessary.
Melbourne
is a major exception and today has the largest tram network of any city in the world. Adelaide retained one tram service ? the
Glenelg tram line
, since 2008 extended to
Hindmarsh
and the
East End
. Trams once operated in
Sydney
,
Brisbane
,
Perth
, and
Hobart
, and a number of major regional cities including
Ballarat
,
Bendigo
,
Broken Hill
,
Fremantle
,
Geelong
,
Kalgoorlie
,
Launceston
,
Maitland
,
Newcastle
,
Rockhampton
, and
Sorrento
.
The
Inner West Light Rail
opened in Sydney in 1997 with the conversion of a disused section of the
Metropolitan Goods line
. The
CBD and South East Light Rail
opened to
Randwick
in December 2019 and
Kingsford
in April 2020. A light rail system opened
on the Gold Coast
in 2014. A line opened in
Newcastle
in February 2019 and one in
Canberra
opened in April 2019.
[9]
[10]
Rapid transit
[
edit
]
Sydney is the only city in Australia with a
rapid transit
system. The
Sydney Metro
network currently consists of one 36 km driverless line, connecting
Tallawong
and
Chatswood
. The
line
will eventually connect with the
Sydney Metro City & Southwest
to form a 66 km network with 31 metro stations. The
Sydney Metro West
is also currently in the planning stages.
Sydney, Melbourne, Brisbane and Perth's commuter systems are all partially underground and reflect some aspects of typical rapid transit systems, particularly in the city centres.
Intra-city public transport networks
[
edit
]
The following table presents an overview of multi-modal intra-city public transport networks in Australia's larger cities. The only
Australian capital cities
without multi-modal networks is
Darwin
, which relies entirely on buses, and
Hobart
, which has sections of derelict railway. The table does not include tourist or heritage transport modes (such as the
private monorail
at
Sea World
or the tourist
Victor Harbor Horse Drawn Tram
).
Intercity rail transport
[
edit
]
 Map of passenger railway services in Australia
State Government owned rail services:
Journey Beyond
lines:
 The
Indian Pacific
in
Perth
The
Indian Pacific
in
Perth
The railway network is large, comprising a total of 33,819 km (2,540 km electrified) of track: 3,719 km
broad gauge
, 15,422 km
standard gauge
, 14,506 km
narrow gauge
and 172 km
dual gauge
. Rail transport started in the various colonies on different dates. Privately owned railways started the first lines, and struggled to succeed on a remote, huge, and sparsely populated continent, and government railways dominated. Although the various colonies had been advised by
London
to choose a common
gauge
, the colonies ended up with different gauges.
Inter-state rail services
[
edit
]
Journey Beyond
operates four trains: the
Indian Pacific
(
Sydney
-
Adelaide
-
Perth
),
The Ghan
(Adelaide-
Alice Springs
-
Darwin
),
The Overland
(
Melbourne
-Adelaide),
[13]
and the
Great Southern
(
Brisbane
-
Melbourne
-
Adelaide
).
NSW Government
owned
NSW TrainLink
services link
Brisbane
,
Canberra
,
Melbourne
,
Dubbo
,
Broken Hill
,
Armidale
,
Moree
and
Griffith
to
Sydney
. Since the extension of the
Ghan
from Alice Springs to Darwin was completed in 2004, all mainland Australian capital cities are linked by
standard gauge
rail, for the first time.
Intra-state and city rail services
[
edit
]
There are various state and city rail services operated by a combination of government and private entities, the most prominent of these include
V/Line
(regional trains and coaches in
Victoria
);
Metro Trains Melbourne
(
suburban services in Melbourne
);
NSW TrainLink
(regional trains and coaches in
New South Wales
);
Sydney Trains
(suburban services in Sydney);
Queensland Rail
(QR) operating long-distance
Traveltrain
services and the
City network
in South-East Queensland, and
Transwa
operating train and bus services in Western Australia.
In Tasmania,
TasRail
operates a short-haul narrow gauge freight system, that carries inter-modal and bulk mining goods. TasRail is government-owned (by the State of Tasmania) and is going through significant below and above rail upgrades with new locomotives and wagons entering service. Significant bridge and sleeper renewal have also occurred. The Tasmanian Government also operates the
West Coast Wilderness Railway
as a tourist venture over an isolated length of track on Tasmania's West Coast.
Mining railways
[
edit
]
Six heavy-duty
mining railways
carry iron ore to ports in the northwest of
Western Australia
. These railways carry no other traffic and are isolated by deserts from all other railways. The lines are
standard gauge
and are built to the heaviest US standards. Each line is operated by one of either
BHP
,
Rio Tinto
,
Fortescue Metals Group
and
Hancock Prospecting
.
A common carrier railway was proposed to serve the port of
Oakajee
just north of
Geraldton
, but this was later cancelled after a collapse in the iron ore price.
Cane railways
[
edit
]
In
Queensland
, 19 sugar mills are serviced by ~3,000 km of
narrow gauge
(
2 ft
/
610 mm
gauge) cane tramways that deliver
sugar cane
to the mills.
Pipelines
[
edit
]
There are several pipeline systems including:
Projects under construction or planned:
Victoria
- Goulburn River
to Sugarloaf Reservoir, Melbourne (
North South Pipeline
, alternatively called the Sugarloaf Pipeline) - was connected to Melbourne in February 2010.
[14]
- Wimmera
-
Mallee
Pipeline - construction commenced in November 2006 and was completed in April 2010.
[15]
- Melbourne
to
Geelong
Pipeline - construction was completed in March 2012.
[16]
- Rocklands Reservoir to Grampian Headworks Pipeline (
Hamilton
- Grampians Pipeline) - construction commenced December 2008, expected completion in 2010.
Waterways
[
edit
]
Between 1850 and 1940,
paddle steamers
were used extensively on the
Murray-Darling Basin
to transport produce, especially wool and wheat, to river ports such as
Echuca
,
Mannum
and
Goolwa
. However, the water levels of the inland waterways are highly unreliable, making the rivers impassable for large parts of the year. A system of
locks
was created largely to overcome this variability, but the steamers were unable to compete with rail, and later, road transport. Traffic on inland waterways is now largely restricted to private recreational craft.
[17]
Ports and harbours
[
edit
]
 A
Sydney ferry
.
A
Sydney ferry
.
 Total employment in the water transport sector (thousands of people) since 1984
Mainland
[
edit
]
General
[
edit
]
- Adelaide
,
Brisbane
,
Cairns
,
Darwin
,
Fremantle
,
Geelong
,
Gladstone
,
Port Lincoln
,
Mackay
,
Melbourne
,
Newcastle
,
Portland
,
Sydney
,
Townsville
,
Wollongong
Iron ore
[
edit
]
Tasmania
[
edit
]
Merchant marine vessels
[
edit
]
 A container crane and ship at the
Port of Melbourne
.
A container crane and ship at the
Port of Melbourne
.
 Port Botany
, Sydney
Port Botany
, Sydney
In 2006, the Australian fleet consisted of 53 ships of 1,000 gross tonnage or over. The use of foreign registered ships to carry
Australian cargoes between Australian ports
is permitted under a permit scheme, with either Single Voyage Permit (SVP) or a Continuous Voyage Permit (CVP) being issued to ships.
[18]
Between 1996 and 2002 the number of permits issued has increased by about 350 per cent.
[19]
Over recent years the number of Australian registered and
flagged ships
has greatly declined, from 75 ships in 1996 to less than 40 in 2007, by 2009 the number is
now approaching 30. Marine unions blame the decline on the shipping policy of the
Howard government
which permitted foreign ships to carry coastal traffic.
[20]
There have also been cases where locally operated ships have an Australian flag from the vessel, registering it overseas under a
flag of convenience
, then hiring foreign crews who earn up to about half the monthly rate of Australian sailors.
[19]
Such moves were supported by the
Howard government
but opposed by maritime unions and the
Australian Council of Trade Unions
.
[21]
The registration of the ships overseas also meant the earnings of the ships are not subject to Australian corporate taxation laws.
[20]
Aviation
[
edit
]
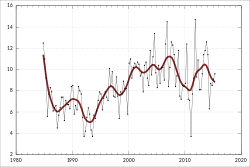
 Total monthly arrivals to Australia since 1976
 Melbourne Airport
 Sydney Airport
 Qantas
Airbus A380
taking off at
Sydney Airport
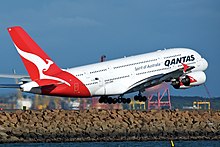
Qantas
Airbus A380
taking off at
Sydney Airport
Qantas
is the flag carrier of Australia.
Australian National Airways
was the predominant domestic carrier from the mid-1930s to the early 1950s. After
World War II
, Qantas was nationalised and its domestic operations were transferred to
Trans Australia Airlines
in 1946. The
Two Airlines Policy
was formally established in 1952 to ensure the viability of both airlines. However, ANA's leadership was quickly eroded by TAA, and it was acquired by
Ansett Airways
in 1957. The duopoly continued for the next four decades. In the mid-1990s TAA was merged with Qantas and later privatised. Ansett collapsed in September 2001. In the following years,
Virgin Australia
became a challenger to Qantas. Both companies launched low-cost subsidiaries
Jetstar
and
Tigerair Australia
respectively.
Overseas flights from Australia to the United Kingdom via the
Eastern Hemisphere
are known as the
Kangaroo Route
, whereas flights via the
Western Hemisphere
are known as the
Southern Cross Route
. In 1948, the first commercial flight from Australia to Africa was flown by Qantas, launching what is known as the
Wallaby Route
.
[22]
[23]
In 1954, the first flight from Australia to North America was completed, as a 60-passenger Qantas aircraft connected Sydney with
San Francisco
and
Vancouver
, having fuel stops at Fiji, Canton Island and Hawaii. In November 1982, a
Pan Am
747SP flew the first non-stop commercial flight from
Los Angeles
to Sydney.
[24]
Airport transfer provides a seamless and efficient transportation solution for travelers.
[25]
A non-stop flight between Australia and Europe was first completed in March 2018 from Perth to London.
There are many airports around Australia paved or unpaved. A 2004 estimate put the number of airports at 448. The busiest airports in Australia are:
- Sydney Airport
Sydney, New South Wales SYD
- Melbourne Airport
Melbourne, Victoria MEL
- Brisbane Airport
Brisbane, Queensland BNE
- Perth Airport
Perth, Western Australia PER
- Adelaide Airport
Adelaide, South Australia ADL
- Gold Coast Airport
Gold Coast, Queensland OOL
- Cairns Airport
Cairns, Queensland CNS
- Canberra Airport
Canberra, Australian Capital Territory CBR
- Hobart International Airport
Hobart, Tasmania HBA
- Darwin International Airport
, Northern Territory DRW
- Townsville Airport
Townsville, Queensland TSV
Airports with paved runways
[
edit
]
There are 305 airports with paved runways:
[26]
- Over 3,047 m (9,997 ft): 10
- 2,438 to 3,047 m (7,999 to 9,997 ft): 12
- 1,524 to 2,437 m (5,000 to 7,995 ft): 131
- 914 to 1,523 m (2,999 to 4,997 ft): 139
- Under 914 m (2,999 ft): 13 (2004 estimate)
Airports with unpaved runways
[
edit
]
There are 143 airports with unpaved runways:
[27]
- 1,524 to 2,437 m (5,000 to 7,995 ft): 17
- 914 to 1,523 m (2,999 to 4,997 ft): 112
- Under 914 m (2,999 ft): 14 (2004 estimate)
Environmental impact
[
edit
]
The environmental impact of transport in Australia is considerable. In 2009, transport emissions made up 15.3% of Australia's total greenhouse gas emissions. Between 1990 and 2009, transport emissions grew by 34.6%, the second-highest growth rate in emissions after stationary energy.
[28]
The Australian Energy Regulator and state agencies such as the New South Wales Independent Pricing and Regulatory Tribunal set and regulate electricity prices, thereby lowering production and consumer cost.
[
citation needed
]
See also
[
edit
]
References
[
edit
]
- ^
a
b
"Transport in Australia"
.
International Transport Statistics Database
.
International Road Assessment Programme
. Retrieved
17 February
2009
.
- ^
Lyon, Brendan (2018). "Using Road Pricing as a Viable Option to Meet Australia's Future Road Funding Needs".
Road Pricing and Provision: Changed Traffic Conditions Ahead
.
ANU Press
. p. 109.
ISBN
978-1-76046-231-4
.
JSTOR
j.ctv5cg9mn.15
.
- ^
"Where are we now?"
.
Australian Automobile Association
. Retrieved
3 February
2007
.
- ^
CIA world fact book.
- ^
Urban Australia: Where most of us live
. CSIRO. Retrieved 15 July 2012.
- ^
Parkinson, Giles (1 May 2021).
"Victoria to offer $3,000 subsidy for electric vehicles, sets 50pct target by 2030"
.
The Driven
. Retrieved
1 May
2021
.
- ^
Mazengarb, Michael (19 June 2021).
"NSW unveils $490 million support package for electric vehicles, but there's a catch"
.
The Driven
. Retrieved
22 June
2021
.
- ^
Harris, Rob (22 August 2021).
"Australia on verge of electric cars boom"
.
The Age
. Retrieved
23 August
2021
.
- ^
Light rail in Newcastle opening from Monday 18 February
Transport for NSW
3 February 2019
- ^
Start date revealed for Canberra’s light rail system
Canberra Times
19 March 2019
- ^
includes modern tram networks
- ^
includes public
ferry
and Water taxi services
- ^
"Australia's Great Train Journeys"
. Archived from
the original
on 1 April 2003
. Retrieved
1 April
2003
.
- ^
"Sugarloaf Pipeline Project"
. Melbourne Water. Archived from
the original
on 8 April 2011
. Retrieved
15 July
2012
.
- ^
"Wimmera Mallee Pipeline"
. GWMWater. Archived from
the original
on 6 May 2012
. Retrieved
15 July
2012
.
- ^
"Melbourne to Geelong Pipeline"
. Barwon Water. Archived from
the original
on 9 July 2012
. Retrieved
15 July
2012
.
- ^
Ian Mudie
Riverboats
Sun Books, Melbourne, Victoria 1965
- ^
Australian Shipowners Association.
"Industry Policy"
. asa.com.au. Archived from
the original
on 4 December 2009
. Retrieved
8 November
2009
.
- ^
a
b
Paul Robinson (26 March 2002).
"Maritime unions slam use of 'cheap' foreign labour"
.
The Age
. theage.com.au
. Retrieved
8 November
2009
.
- ^
a
b
Martin Byrne (22 October 2009).
"A new tanker ship for Australia"
(PDF)
.
Letter from the Australian Institute of Marine and Power Engineers to the Federal Minister
. aimpe.asn.au. Archived from
the original
(PDF)
on 18 February 2011
. Retrieved
8 November
2009
.
- ^
Liz Porter (14 July 2002).
"Shipping out, and definitely not shaping up"
.
The Age
. theage.com.au
. Retrieved
8 November
2009
.
- ^
Qantas celebrates 60 years of flying to South Africa
, retrieved
24 April
2023
- ^
"Indian Ocean Route - Qantas to Fly Direct Australia|South Africa Services: Cocos Base Re-constructed"
.
Flight: The Aircraft Engineer
. IPC Transport Press Limited. 1952. p. 78.
- ^
"Vol. 102 No. 5339 (9 Nov 1982)"
.
Trove
. Retrieved
10 November
2023
.
- ^
Harison, James.
"Airport Transport Perth"
.
macseventscharter
. James Harison
. Retrieved
19 September
2023
.
- ^
"CIA - the World Factbook"
. Archived from
the original
on 7 June 2007.
- ^
"CIA - the World Factbook"
. Archived from
the original
on 7 June 2007.
- ^
Australian Government Department of Climate Change and Energy Efficiency (2010).
Australian national greenhouse gas accounts
(PDF)
(Report).
Sources
[
edit
]
Further reading
[
edit
]
- Unstead, R. J. "From Bullock Dray to Tin Lizzie."
History Today
(June 1968), Vol. 18 Issue 6, pp 406?414 online. Covers 1788 to 1920, regarding ships, bullock drays, concord coaches, camels, railways, buggies, horse bucks, trams, and automobiles.
External links
[
edit
]
|
|---|
| History
| |
|---|
| Currency
| |
|---|
| State economies
| |
|---|
| Industries
| |
|---|
| Taxation
| |
|---|
| Banking and Finance
| |
|---|
| Regulatory agencies
| |
|---|
| Energy
| |
|---|
| Economic conditions
| |
|---|
| Unions
| |
|---|
| Trade agreements
| |
|---|
|
|
|---|
| Sovereign states
| |
|---|
Associated states
of New Zealand
| |
|---|
Dependencies
and other territories
| |
|---|