1000-km-order method of measuring weather systems
In
meteorology
, the
synoptic scale
(also called the
large scale
or
cyclonic scale
) is a
horizontal
length scale
of the
order
of 1,000 km (620 mi) or more.
[1]
This corresponds to a horizontal scale typical of
mid-latitude
depressions
(e.g.
extratropical cyclones
). Most
high-
and
low-pressure areas
seen on
weather maps
(such as
surface weather analyses
) are synoptic-scale systems, driven by the location of
Rossby waves
in their respective hemisphere. Low-pressure areas and their related frontal zones occur on the leading edge of a trough within the Rossby wave pattern, while
high-pressure areas
form on the back edge of the trough. Most
precipitation
areas occur near frontal zones. The word
synoptic
is derived from the
Ancient Greek
word
συνοπτικ??
(
sunoptikos
), meaning "seen together".
The
Navier?Stokes equations
applied to atmospheric motion can be simplified by
scale analysis
in the synoptic scale. It can be shown that the main terms in horizontal equations are
Coriolis force
and
pressure gradient
terms; therefore, one can use
geostrophic approximation
. In vertical coordinates, the momentum equation simplifies to the
hydrostatic equilibrium
equation.
Surface weather analysis
[
edit
]
 A surface weather analysis for the United States on October 21, 2006.
A
surface weather analysis
is a special type of
weather map
that provides a view of
weather
elements over a geographical area at a specified time based on information from ground-based weather stations.
[2]
Weather maps are created by plotting or tracing the values of relevant quantities such as
sea level pressure
,
temperature
, and
cloud cover
onto a
geographical map
to help find
synoptic scale
features such as
weather fronts
.
The first weather maps in the 19th century were drawn well after the fact to help devise a theory on storm systems.
[3]
After the advent of the
telegraph
, simultaneous
surface weather observations
became possible for the first time. Beginning in the late 1840s, the
Smithsonian Institution
became the first organization to draw real-time surface analyses. Use of surface analyses began first in the United States, spreading worldwide during the 1870s. Use of the
Norwegian cyclone model
for frontal analysis began in the late 1910s across Europe, with its use finally spreading to the United States during
World War II
.
Surface weather analyses have special symbols which show frontal systems, cloud cover,
precipitation
, or other important information. For example, an
H
represents
high pressure
, implying good and fair weather. An
L
represents
low pressure
, which frequently accompanies precipitation. Various symbols are used not just for frontal zones and other surface boundaries on weather maps, but also to depict the present weather at various locations on the weather map. Areas of precipitation help determine the frontal type and location. Mesoscale systems and boundaries such as
tropical cyclones
, outflow boundaries and
squall lines
are also analyzed on surface weather analyses. Isobars are commonly used to place surface boundaries from the
horse latitudes
poleward, while streamline analyses are used in the tropics.
[4]
 A fictitious synoptic chart of an extratropical cyclone affecting the UK and Ireland. The blue arrows between
isobars
indicate the direction of the wind, while the "L" symbol denotes the centre of the "low". Note the occluded, cold and warm
frontal boundaries
.
A fictitious synoptic chart of an extratropical cyclone affecting the UK and Ireland. The blue arrows between
isobars
indicate the direction of the wind, while the "L" symbol denotes the centre of the "low". Note the occluded, cold and warm
frontal boundaries
.
An extratropical cyclone is a synoptic scale
low-pressure
weather system that has neither
tropical
nor
polar
characteristics, being connected with
fronts
and horizontal
gradients
in
temperature
and
dew point
otherwise known as "baroclinic zones".
The descriptor "extratropical" refers to the fact that this type of cyclone generally occurs outside of the tropics, in the middle latitudes of the planet. These systems may also be described as "mid-latitude cyclones" due to their area of formation, or "post-tropical cyclones" where
extratropical transition
has occurred,
but are often described as "depressions" or "lows" by weather forecasters and the public. These are the everyday phenomena that, along with
anticyclones
, drive the weather over much of the Earth.
Although extratropical cyclones are almost always classified as
baroclinic
since they form along zones of temperature and dew point gradient within the
westerlies
, they can sometimes become
barotropic
late in their life cycle when the temperature distribution around the cyclone becomes fairly uniform with radius.
[7]
An extratropical cyclone can transform into a subtropical storm, and from there into a tropical cyclone, if it dwells over warm waters and develops central convection, which warms its core.
[8]
Surface high-pressure systems
[
edit
]
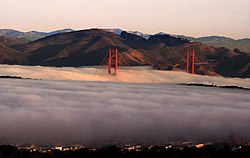 Golden Gate Bridge
in fog
Golden Gate Bridge
in fog
High-pressure systems are frequently associated with light winds at the surface and
subsidence
through the lower portion of the
troposphere
. Subsidence will generally dry out an air mass by
adiabatic
, or compressional, heating.
[9]
Thus, high pressure typically brings clear skies.
[10]
During the day, since no clouds are present to reflect sunlight, there is more incoming shortwave
solar radiation
and temperatures rise. At night, the absence of clouds means that
outgoing longwave radiation
(i.e. heat energy from the surface) is not absorbed, giving cooler
diurnal
low temperatures in all seasons. When surface winds become light, the subsidence produced directly under a high-pressure system can lead to a buildup of particulates in urban areas under the ridge, leading to widespread
haze
.
[11]
If the low level
relative humidity
rises towards 100 percent overnight,
fog
can form.
[12]
Strong, vertically shallow high-pressure systems moving from higher latitudes to lower latitudes in the northern hemisphere are associated with continental arctic air masses.
[13]
The low, sharp
inversion
can lead to areas of persistent
stratocumulus
or
stratus cloud
, colloquially known as anticyclonic gloom. The type of weather brought about by an anticyclone depends on its origin. For example, extensions of the Azores high pressure may bring about anticyclonic gloom during the winter, as they are warmed at the base and will trap moisture as they move over the warmer oceans. High pressures that build to the north and extend southwards will often bring clear weather. This is due to being cooled at the base (as opposed to warmed) which helps prevent clouds from forming.
On weather maps, these areas show converging winds (isotachs), also known as
confluence
, or converging height lines near or above the level of non-divergence, which is near the 500 hPa pressure surface about midway up through the troposphere.
[14]
[15]
High-pressure systems are alternatively referred to as anticyclones. On weather maps, high-pressure centers are associated with the letter H in English,
[16]
or A in Spanish,
[17]
because alta is the Spanish word for high, within the
isobar
with the highest pressure value. On constant pressure upper level charts, it is located within the highest height line contour.
[18]
Weather fronts
[
edit
]
 Different air masses tend to be separated by frontal boundaries. The Arctic front separates Arctic from Polar air masses, while the Polar front separates Polar air from warm air masses. (cA is continental arctic; cP is continental polar; mP is maritime polar; cT is continental tropic; and mT is maritime tropic.)
A
weather front
is a boundary separating two
masses of air
of different
densities
, and is the principal cause of
meteorological phenomena
. In
surface weather analyses
, fronts are depicted using various colored lines and symbols, depending on the type of front. The air masses separated by a front usually differ in
temperature
and
humidity
.
Cold fronts may feature narrow bands of
thunderstorms
and
severe weather
, and may on occasion be preceded by
squall lines
or
dry lines
.
Warm fronts
are usually preceded by
stratiform
precipitation
and
fog
. The weather usually clears quickly after a front's passage. Some fronts produce no precipitation and little cloudiness, although there is invariably a wind shift.
[19]
Cold fronts and
occluded fronts
generally move from west to east, while warm fronts move
poleward
. Because of the greater density of air in their wake, cold fronts and cold occlusions move faster than warm fronts and warm occlusions.
Mountains
and warm bodies of water can slow the movement of fronts.
[20]
When a front becomes
stationary
, and the density contrast across the frontal boundary vanishes, the front can degenerate into a line which separates regions of differing wind velocity, known as a shearline. This is most common over the open ocean.
See also
[
edit
]
References
[
edit
]
External links
[
edit
]