Measurement describing the power of an illumination
 CIE standard illuminant
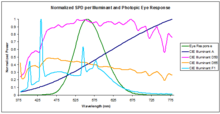
spectral power distribution comparisons referenced to the human visual system
photopic response
CIE standard illuminant
spectral power distribution comparisons referenced to the human visual system
photopic response
In
radiometry
,
photometry
, and
color science
, a
spectral power distribution
(
SPD
) measurement describes the
power
per unit
area
per unit
wavelength
of an
illumination
(
radiant exitance
). More generally, the term
spectral power distribution
can refer to the concentration, as a function of wavelength, of any radiometric or photometric quantity (e.g.
radiant energy
,
radiant flux
,
radiant intensity
,
radiance
,
irradiance
,
radiant exitance
,
radiosity
,
luminance
,
luminous flux
,
luminous intensity
,
illuminance
,
luminous emittance
).
[1]
[2]
[3]
[4]
Knowledge of the SPD is crucial for optical-sensor system applications.
Optical properties
such as
transmittance
,
reflectivity
, and
absorbance
as well as the sensor response are typically dependent on the incident wavelength.
[3]
Physics
[
edit
]
Mathematically, for the spectral power distribution of a radiant exitance or irradiance one may write:

where
M
(
λ
) is the
spectral irradiance
(or exitance) of the light (
SI
units:
W
/m
2
=
kg
·m
?1
·
s
?3
);
Φ
is the radiant flux of the source (SI unit: watt, W);
A
is the area over which the radiant flux is integrated (SI unit: square meter, m
2
); and
λ
is the wavelength (SI unit: meter, m). (Note that it is more convenient to express the wavelength of light in terms of
nanometers
; spectral exitance would then be expressed in units of W·m
?2
·nm
?1
.) The approximation is valid when the area and wavelength interval are small.
[5]
Relative SPD
[
edit
]
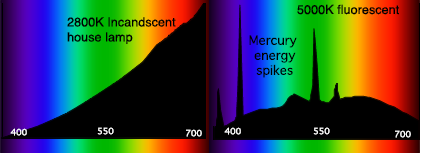 Characteristic spectral power distributions (SPDs) for an
incandescent lamp
(left) and a
fluorescent lamp
(right). The horizontal axes are in
nanometers
and the vertical axes show relative intensity in arbitrary units.
Characteristic spectral power distributions (SPDs) for an
incandescent lamp
(left) and a
fluorescent lamp
(right). The horizontal axes are in
nanometers
and the vertical axes show relative intensity in arbitrary units.
The ratio of spectral concentration (irradiance or exitance) at a given wavelength to the concentration of a reference wavelength provides the relative SPD.
[4]
This can be written as:

For instance, the
luminance
of lighting fixtures and other light sources are handled separately, a spectral power distribution may be normalized in some manner, often to unity at 555 or 560 nanometers, coinciding with the peak of the eye's
luminosity function
.
[2]
[6]
Responsivity
[
edit
]
The SPD can be used to determine the response of a
sensor
at a specified wavelength. This compares the output power of the sensor to the input power as a function of wavelength.
[7]
This can be generalized in the following formula:

Knowing the responsitivity is beneficial for determination of illumination, interactive material components, and optical components to optimize performance of a system's design.
Source SPD and matter
[
edit
]
 Figure showing the greater proportion of blue light scattered by the atmosphere relative to red light.
The spectral power distribution over the
visible spectrum
from a source can have varying concentrations of relative SPDs. The interactions between light and matter affect the absorption and reflectance properties of materials and subsequently produces a color that varies with source illumination.
[8]
For example, the relative spectral power distribution of the sun produces a white appearance if observed directly, but when the sunlight illuminates the Earth's atmosphere the sky appears blue under normal daylight conditions. This stems from the optical phenomenon called
Rayleigh scattering
which produces a concentration of shorter wavelengths and hence the blue color appearance.
[3]
Source SPD and color appearance
[
edit
]
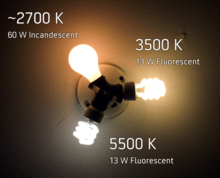 Color temperature comparison of common electric lamps
The human visual response relies on
trichromacy
to process color appearance. While the human visual response integrates over all wavelengths, the relative spectral power distribution will provide
color appearance modeling
information as the concentration of wavelength band(s) will become the primary contributors to the perceived color.
[8]
This becomes useful in photometry and
colorimetry
as the perceived color changes with source illumination and spectral distribution and coincides with
metamerisms
where an object's color appearance changes.
[8]
The spectral makeup of the source can also coincide with
color temperature
producing differences in color appearance due to the source's temperature.
[4]
See also
[
edit
]
References
[
edit
]
External links
[
edit
]