Regular period of greatest solar activity
 A prediction for Sunspot Cycle 24 (2008-2020) gives a smoothed sunspot number maximum of about 66 in the Summer of 2013. Current observations make this the smallest sunspot cycle since records began in the 1750s.
[1]
A prediction for Sunspot Cycle 24 (2008-2020) gives a smoothed sunspot number maximum of about 66 in the Summer of 2013. Current observations make this the smallest sunspot cycle since records began in the 1750s.
[1]
Solar maximum
is the regular period of greatest
solar activity
during the
Sun
's 11-year
solar cycle
. During solar maximum, large numbers of
sunspots
appear, and the
solar irradiance
output grows by about 0.07%.
[2]
On average, the
solar cycle
takes about 11 years to go from one solar maximum to the next, with duration observed varying from 9 to 14 years.
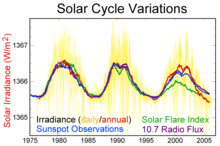 Three recent solar cycles
Large
solar storms
often occur during solar maximum. For example, the
Carrington Event
, which took place a few months before the solar maximum of
solar cycle 10
, was the most intense
geomagnetic storm
in
recorded history
and widely considered to have been caused by an equally large solar storm.
[3]
Predictions
[
edit
]
Predictions of a future maximum's timing and strength are very difficult; predictions vary widely. There was a solar maximum in 2000. In 2006,
NASA
initially expected a solar maximum in 2010 or 2011, and thought that it could be the strongest since
1958
.
[4]
However, the solar maximum was not declared to have occurred until 2014, and even then was ranked among the weakest on record.
[5]
Grand solar minima and maxima
[
edit
]
In addition to the ~11 year solar cycle, the intensity of the solar maxima can vary from cycle to cycle. When several solar cycles exhibit greater than average activity for decades or centuries, this period is labelled "Grand solar maximum". Solar cycles still occur during these grand solar maximum periods, but the intensity of those cycles is greater. Likewise, extended periods in which the solar maximum is lower than average are labeled "grand solar minima". Some researchers suggest that grand solar maxima have shown some correlation with global and regional climate changes, although others dispute this hypothesis (
e.g.
, see
Medieval Warm Period
).
Following the advent of telescopic solar observation with Galileo's 1611 observations, the intensity of solar maxima is typically measured by counting numbers and size of sunspots; for periods previous to this, isotope ratios in
ice cores
can be used to estimate solar activity. The table below shows the approximate dates of some of the proposed solar minima in historical times.
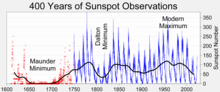 400 year history of
sunspot numbers
.
400 year history of
sunspot numbers
.
A proposed list of historical Grand minima of solar activity
[7]
includes also Grand minima ca. 690 AD, 360 BC, 770 BC, 1390 BC, 2860 BC, 3340 BC, 3500 BC, 3630 BC, 3940 BC, 4230 BC, 4330 BC, 5260 BC, 5460 BC, 5620 BC, 5710 BC, 5990 BC, 6220 BC, 6400 BC, 7040 BC, 7310 BC, 7520 BC, 8220 BC, 9170 BC.
See also
[
edit
]
References
[
edit
]