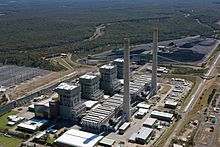
 Eraring coal fired power station
, Australia's largest power station.
Eraring coal fired power station
, Australia's largest power station.
 Energy consumption by source, Australia.
Energy in Australia
is the production in
Australia
of
energy
and
electricity
, for consumption or export.
Energy policy of Australia
describes the
politics of Australia
as it relates to energy.
In 2021, Australia was a net exporter of energy commodities, with notable exports in
liquefied natural gas
(LNG),
coal
, and
minerals.
[1]
Energy in Australia is sourced largely from coal and natural gas,
[2]
however, recently, due to the increasing
effects of global warming
and human-induced
climate change
on the global environment, there has been a shift towards
renewable energy
such as
solar power
and
wind power
both in Australia and abroad.
[3]
[4]
In 2022, renewable energy accounted for 35.9% of the total amount of electricity generated in Australia.
[5]
Overview
[
edit
]
 Infographic showing Australian energy production, consumption, imports, and exports by fuel type and industry
Australian
total primary energy supply
(TPES) by fuel type (in PJ)
[6]
| Year
|
Oil
|
Coal
|
Natural Gas
|
Renewables
|
Total
|
| 2009-10
|
2,058 (34.6%)
|
2,229 (37.5%)
|
1,372 (23.1%)
|
286 (4.8%)
|
5,945
|
| 2010-11
|
2,195 (36.0%)
|
2,129 (34.9%)
|
1,516 (24.8%)
|
260 (4.3%)
|
6,100
|
| 2011-12
|
2,411 (38.9%)
|
2,118 (34.2%)
|
1,399 (22.6%)
|
265 (4.3%)
|
6,194
|
| 2012-13
|
2,221 (37.7%)
|
1,946 (33.1%)
|
1,386 (23.6%)
|
330 (5.6%)
|
5,884
|
| 2013-14
|
2,237.8 (38.4%)
|
1,845.6 (31.7%)
|
1,401.9 (24.0%)
|
345.7 (5.9%)
|
5,831.1
|
| 2014-15
|
2,237.4 (37.8%)
|
1,907.8 (32.2%)
|
1,431.0 (24.2%)
|
343.3 (5.8%)
|
5,919.6
|
| 2015-16
|
2,243.3 (37.0%)
|
1,956.1 (32.2%)
|
1,504.9 (24.8%)
|
361.6 (6.0%)
|
6,065.9
|
| 2016-17
|
2,315.4 (37.7%)
|
1,936.9 (31.5%)
|
1,515.0 (24.7%)
|
378.7 (6.2%)
|
6,145.8
|
| 2017-18
|
2,387.8 (38.7%)
|
1,847.2 (29.9%)
|
1,554.6 (25.2%)
|
382.1 (6.2%)
|
6,171.7
|
| 2018-19
|
2,402.1 (38.8%)
|
1,801.6 (29.1%)
|
1,592.7 (25.7%)
|
399.6 (6.4%)
|
6,196.0
|
| 2019-20
|
2,241.2 (37.3%)
|
1,706.6 (28.4%)
|
1,647.2 (27.4%)
|
418.8 (7.0%)
|
6,013.8
|
| 2020-21
|
2,097.9 (36.2%)
|
1,661.0 (28.7%)
|
1,568.2 (27.1%)
|
462.4 (8.0%)
|
5,789.6
|
| 2021-22
|
2,103.4 (36.5%)
|
1,586.8 (27.5%)
|
1,559.3 (27.1%)
|
512.5 (8.9%)
|
5,762.1
|
In 2009, Australia had the highest
per capita CO
2
emissions
in the world. At that time, Maplecroft's CO
2
Energy Emissions Index (CEEI) showed that Australia releases 20.58 tons of CO
2
per person per year, more than any other country.
[7]
However, emissions have since been reduced. From 1990 to 2017, emissions per capita fell by one-third, with most of that drop occurring in the more recent years. Additionally, the emissions intensity of the economy fell by 58.4 percent during the same time period. These are the lowest values in 27 years.
[8]
The energy sector in Australia increased its carbon dioxide emissions by 8.2% from 2004 to 2010 on average.
Fuels
[
edit
]
Coal
[
edit
]
In 2009, Australia was the fourth-highest coal producer in the world, producing 335
megatonnes
(Mt) of
anthracite
(black coal) and 64 Mt of
lignite
(brown coal).
[9]
Australia was the biggest anthracite exporter, with 31% of global exports (262 Mt out of 836 Mt total). Lignite is not exported. 78% of its 2009 anthracite production was exported (262 Mt out of 335 Mt total). In this respect, Australia is an exception to most anthracite exporters. Australia's global anthracite export share was 14% of all production (836 Mt out of 5,990 Mt total).
[10]
In 2015, Australia was the biggest net exporter of coal, with 33% of global exports (392 Mt out of 1,193 Mt total). It was still the fourth-highest anthracite producer with 6.6% of global production (509 Mt out of 7,709 Mt total). 77% of production was exported (392 Mt out of 509 Mt total).
[11]
[12]
In 2021, Australia was the world's fifth-largest
hard coal
producer, following China, India, the United States, and Indonesia. Coal remained important to Australia's energy sector, representing 64% of domestic energy production, 32% of the Total Energy Supply (TES), and 53% of electricity generation. Moreover, Australia had the second-highest usage of coal in energy production and electricity generation among
International Energy Agency
(IEA) countries. Between 2010 and 2020, the share of coal in energy production dropped from 76% to 65%, in TES from 40% to 30%, and in electricity generation from 71% to 55%.
[13]
In 2020, Australia operated 91
hard coal
and three
lignite
mines, with over 200 coal deposits. Most hard coal mines were in
Queensland
(67%) and
New South Wales
(30%), while lignite mines were mainly in Victoria's Gippsland Basin, notably the
Latrobe Valley
.
[13]
Natural gas
[
edit
]
 Proportion of national total of natural gas reserves, 2008
 Natural-gas pipeline in Western Australia, 2004
Australia's natural-gas reserves are an estimated 3,921 billion cubic metres (bcm), of which 20% are considered commercially proven (783 bcm). The gas basins with the largest recoverable reserves are the Carnarvon and Browse basins in Western Australia; the
Bonaparte Basin
in the
Northern Territory
; the Gippsland and Otway basins in
Victoria
and the
Cooper
-
Eromanga
basin in South Australia and
Queensland
. In 2014?2015 Australia produced 66 bcm of natural gas, of which approximately 80% was produced in Western Australia and Queensland regions.
[14]
Australia also produces LNG; LNG exports in 2004 were 7.9 Mt (10.7 bcm), 6% of world LNG trade.
[15]
Australia also has large deposits of coal seam methane (CSM), most of which are located in the anthracite deposits of Queensland and New South Wales.
[15]
On 19 August 2009, Chinese petroleum company
PetroChina
signed a A$50 billion deal with American multinational petroleum company
ExxonMobil
to purchase
liquefied natural gas
from the Gorgon field in Western Australia,
[16]
[17]
the largest contract signed to date between China and Australia. It ensures China a steady supply of
LPG fuel
for 20 years, forming China's largest supply of relatively clean energy.
[18]
The agreement was reached despite
relations between Australia and China
being at their lowest point in years after the
Rio Tinto espionage case
and the
granting of an Australian visa
to
Rebiya Kadeer
.
[19]
In 2021, natural gas was a significant component of Australia's energy sector, making up 29% of its energy production, 28% of the Total Energy Supply (TES), 19% of electricity generation, and 17% of Total Final Consumption (TFC). Sector-wise, natural gas usage was highest in electricity and heat generation at 33.9%, followed by the industrial sector at 23.3%. Residential buildings accounted for 10.8% of natural gas consumption, while service sector buildings and the transport sector had smaller shares at 2.9% and 1.3%, respectively.
[13]
Australia's oil production peaked in 2000, after gradually increasing since 1980.
[20]
Net oil imports rose from 7% of total consumption in 2000 to 39% in 2006. Decreasing domestic oil production is the result of the decline of oil-producing basins and few new fields going online.
[20]
In 2021, oil comprises 52% of the Total Final Consumption (TFC) and 32% of the Total Energy Supply (TES). It contributes to 4% of domestic energy production and 1.8% of electricity generation. Oil consumption in 2020 was 892.3 thousand barrels per day (kb/d), with domestic transport consuming 65.4% of this amount. Industry, including non-energy consumption, accounted for 22.4%, international bunkering for 9.1%, buildings for 2.4%, and electricity and heat generation for 0.4%.
[13]
Oil shale
[
edit
]
Australia's
oil shale
resources are estimated at 58 billion barrels, or 4,531 million tonnes of
shale oil
. The deposits are located in the eastern and southern states, with the greatest feasibility in the eastern Queensland deposits. Between 1862 and 1952, Australia mined four million tonnes of oil shale. The mining stopped when government support ceased. Since the 1970s, oil companies have been exploring possible reserves. From 2000 to 2004, the
Stuart Oil Shale Project
near
Gladstone, Queensland
produced over 1.5 million barrels of oil. The facility, in operable condition, is on
care and maintenance
and its operator (
Queensland Energy Resources
) is conducting research and design studies for the next phase of its oil-shale operations.
[21]
A campaign by
environmentalists
opposed to the exploitation of oil-shale reserves may also have been a factor in its closure.
[22]
As of 2021, Australia no longer engages in the commercial production of oil shale.
[13]
Uranium
[
edit
]
Australia has many Uranium deposits.
[23]
However, Australia does not have any nuclear power plants.
Electricity
[
edit
]
Since 2005, wind power and rooftop solar have led to an increasing share of renewable energy in total electricity generation.
[24]
Due to its large size and the location of its population, Australia lacks a single grid.
[25]
Australian electricity generation, by fuel type (in GWh)
[6]
| Year
|
Black Coal
|
Natural Gas
|
Brown Coal
|
Oil
|
Other
|
Fossil
Fuels
|
Solar
|
Wind
|
Hydro
|
Bio Energy
|
Renew-
ables
|
| 2009-10
|
51.5% (124,478)
|
15.0% (36,223)
|
23.2% (55,968)
|
1.1% (2,691)
|
1.0% (2,496)
|
91.8%
|
0.1% (278)
|
2.0% (4,798)
|
5.2% (12,522)
|
0.9% (2,113)
|
8.2%
|
| 2010-11
|
46.3% (116,949)
|
19.4% (48,996)
|
21.9% (55,298)
|
1.2% (3,094)
|
1.1% (2,716)
|
89.9%
|
0.3% (850)
|
2.3% (5,807)
|
6.7% (16,807)
|
0.8% (2,102)
|
10.1%
|
| 2011-12
|
47.4% (120,302)
|
19.3% (48,892)
|
21.7% (55,060)
|
1.2% (3,070)
|
1.0% (2,500)
|
90.6%
|
0.6% (1,489)
|
2.4% (6,113)
|
5.5% (14,083)
|
0.9% (2,343)
|
9.4%
|
| 2012-13
|
44.8% (111,491)
|
20.5% (51,053)
|
19.1% (47,555)
|
1.8% (4,464)
|
0.8% (1,945)
|
86.9%
|
1.5% (3,817)
|
2.9% (7,328)
|
7.3% (18,270)
|
1.3% (3,151)
|
13.1%
|
| 2013-14
|
42.6% (105,772.4)
|
21.9% (54,393.9)
|
18.6% (46,076.2)
|
2.0% (5,012.4)
|
-
|
85.1%
|
2.0% (4,857.5)
|
4.1% (10,252.0)
|
7.4% (18,421.0)
|
1.4% (3,511.3)
|
14.9%
|
| 2014-15
|
42.7% (107,639)
|
20.8% (52,463)
|
20.2% (50,970)
|
2.7% (6,799)
|
-
|
86.3%
|
2.4% (5,968)
|
4.5% (11,467)
|
5.3% (13,445)
|
1.4% (3,608)
|
13.7%
|
| 2015-16
|
44.4% (114,295)
|
19.6% (50,536)
|
19.0% (48,796)
|
2.2% (5,656)
|
-
|
85.2%
|
2.7% (6,838)
|
4.7% (12,199)
|
6.0% (15,318)
|
1.5% (3,790)
|
14.8%
|
| 2016-17
|
45.8% (118,272)
|
19.6% (50,460)
|
16.9% (43,558)
|
1.9% (4,904)
|
-
|
84.3%
|
3.1% (8,072)
|
4.9% (12,597)
|
6.3% (16,285)
|
1.4% (3,501)
|
15.7%
|
| 2017-18
|
46.6% (121,702)
|
20.6% (53,882)
|
13.8% (36,008)
|
1.9% (4,904)
|
-
|
82.9%
|
3.8% (9,930)
|
5.8% (15,174)
|
6.1% (16,021)
|
1.3% (3,518)
|
17.1%
|
| 2018-19
|
45.4% (119,845)
|
20.0% (52,775)
|
13.1% (34,460)
|
1.9% (4,923)
|
-
|
80.3%
|
5.6% (14,849)
|
6.7% (17,712)
|
6.0% (15,967)
|
1.3% (3,496)
|
19.7%
|
| 2019-20
|
42.2% (111,873)
|
20.8% (55,216)
|
12.7% (33,649)
|
1.7% (4,509)
|
-
|
77.4%
|
7.9% (21,033)
|
7.7% (20,396)
|
5.7% (15,150)
|
1.3% (3,352)
|
22.6%
|
| 2020-21
|
40.0% (106,251)
|
18.7% (49,783)
|
12.8% (34,060)
|
1.8% (4,662)
|
-
|
73.3%
|
10.4% (27,717)
|
9.2% (24,535)
|
5.7% (15,200)
|
1.3% (3,346)
|
26.7%
|
| 2021-22
|
37.2% (101,076.2)
|
18.1% (49,280.2)
|
12.0% (32,515.6)
|
1.7% (4,664.0)
|
-
|
69.1%
|
12.8% (34,686.7)
|
10.7% (29,107.8)
|
6.3% (17,010.9)
|
1.2% (3,190.3)
|
30.9%
|
 Australia electricity production by source
Electricity supply
[
edit
]
Australian Electricity Generation by Type FY 2021-2022
Black Coal (37.2%)
Natural Gas (18.1%)
Brown Coal (12%)
Oil (1.7%)
Solar (12.8%)
Wind (10.7%)
Hydro (6.3%)
Bio Energy (1.2%)
 Australian Electricity Generation in 2017 (Data from the
Australian Government Department of Industry, Science, Energy and Resources
)
Australian Electricity Generation in 2017 (Data from the
Australian Government Department of Industry, Science, Energy and Resources
)
As of 2011, electricity producers in Australia were not building gas-fired power stations,
[26]
while the four major banks were unwilling to make loans for coal-fired power stations, according to
EnergyAustralia
(formerly TRUenergy).
[27]
In 2014, an oversupply of generation was expected to persist until 2024.
[28]
However, a report published in 2017 by the
Australian Energy Market Operator
projected that energy supply in 2018 and 2019 is expected to meet demands, with a risk of supply falling short at peak demand times.
[29]
From 2003 to 2013 real electric prices for households increased by an average of 72%. Much of this increase in price has been attributed to over-investment in increasing distribution networks and capacity. Further price increases are predicted to be moderate over the next few years (2017 on) due to changes in the regulation of transmission and distribution networks as well as increased competition in electricity wholesale markets as supply and demand merge.
[30]
In 2021, Australia generated a total of 265 Terawatt-hours (TWh) of electricity. The breakdown of the electricity generation mix was as follows: coal at 52.9%, natural gas at 18.8%, solar at 10.5%, wind at 9.3%, hydro at 5.6%, oil at 1.8%, and
bioenergy
and waste at 1.3%. Electricity consumption for the year was 239 TWh, with the industry sector consuming 43%, residential buildings and service sector buildings each contributing 27% to the total consumption, and the transport sector accounting for 3%.
[13]
Renewable energy
[
edit
]
 Renewable Energy by State in Australia
[31]
Renewable Energy by State in Australia
[31]
Renewable energy has potential in Australia, and the
Climate Change Authority
is reviewing the 20-percent Renewable Energy Target (RET). The production of 50 megawatts of wind power (power for nearly 21,000 homes annually) creates about 50 construction jobs and five staff positions.
[32]
[33]
In recent years, wind and solar power have been the fastest growing source of energy in Australia.
[34]
Geothermal energy
is also growing, but at the present time, it only accounts for a small portion of energy in Australia.
Energy efficiency
[
edit
]
Lower energy use could save A$25 billion, or A$840 per electricity customer, according to EnergyAustralia.
[35]
Climate change
[
edit
]
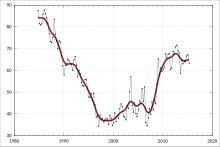
 Graph of Australian temperature variability.
Australian total emissions in 2007 were 396 million tonnes of CO
2
. That year, the country was among the top polluter nations of the world per capita. Australian
per-capita emissions of carbon dioxide
in 2007 were 18.8 tons of CO
2
, compared to the EU average of 7.9 tons. The change in emissions from 1990 to 2007 was +52.5 percent, compared to the EU's -3.3 percent.
[36]
The per-capita
carbon footprint
in Australia was rated 12th in the world by
PNAS
in 2011.
[37]
Due to climate change, Australia is expected to experience harsher extreme weather events, mainly bush-fires and floods during summer.
[38]
Rising sea levels are of particular concern for Australia, because most of the population lives on the coast (around 85%).
[39]
Employment
[
edit
]
 Total employment in the electricity-supply industry (thousands of people) since 1984
 Proportion of adult population employed in the electricity, gas, water, and waste services industries by statistical local area, as of the 2011 census
When analysing employment data, the
Australian Bureau of Statistics
classifies the electricity and gas supply industry as part of the Electricity, Gas, Water and Waste Services Division.
[40]
That division is the smallest industry in Australia in terms of employment.
[41]
In November 2017, the number of people employed in electricity supply, which includes electricity generation, transmission and distribution, was 64,200 (47,700 males, 16,600 females).
[42]
The number of people employed in gas supply was 11,200 (9,000 males, 2,200 females).
[42]
The total number of persons employed in electricity and gas supply industries was 75,400.
[42]
This represents about 0.67 percent of all employed persons in Australia.
[a]
In 2016, the major occupations in this division were truck drivers (9,900), electricians (7,700), electrical distribution trades workers (5,400), and electrical engineers (4,400).
[43]
[a]
Employment in renewable energy activities
[
edit
]
In 2015?16, annual
direct
full-time equivalent
employment in renewable energy in Australia was estimated at 11,150. Employment in renewables peaked in 2011?12, probably due to the employment of construction workers to build renewable energy facilities. However, it decreased by 36 percent in 2014?15, and by a further 16 percent in 2015?16. The decline is attributed to a decrease in the number of
roof-top solar photovoltaic systems
being installed on houses. Once construction of renewable energy facilities is completed, and only ongoing maintenance is required, employment falls quite significantly.
[44]
For most Australian states and territories the major contributor to employment in renewable energy is
solar power
. Employment in roof-top solar photovoltaic systems, including
solar hot water systems
, comprised half of all employment in renewable energy in 2015?16. Employment in large scale solar and wind power is driven primarily by installation activity, rather than ongoing operation and maintenance.
[44]
In
Western Australia
, 93 percent of all jobs in renewable energy are in solar power. The proportion of employment in
biomass
is significantly greater in
Queensland
(42 percent), where the
sugar industry
makes great use of
sugar cane
to generate electricity for sugar milling and to feed into the grid. Most jobs in
Tasmania
's renewable energy industry are in
hydropower
(87 percent).
[44]
Jobs in the renewable energy industry are forecast to grow substantially by 2030, driven by growth in electricity demand and new renewable energy capacity.
[45]
: 16
Conversely, jobs associated with
coal-fired power stations
are forecast to decline as those plants age and close. Such job losses would disproportionately affect some regional areas, such as the
Latrobe Valley
in
Victoria
,
Newcastle
and the
Hunter Valley
in
New South Wales
,
Gladstone
and
Rockhampton
in
Queensland
, and
Collie
in
Western Australia
. However, it is expected that the number of jobs created in renewable energy will far exceed the number of jobs lost in coal-based generation.
[45]
: 35
Energy policy of Australia
[
edit
]
Finkel Report
[
edit
]
In June 2017
Alan Finkel
released
The Independent Review into the Future Security of the National Electricity Market
(commonly referred to as the Finkel Report), which proposed an approach to increasing energy security and reliability through four outcomes. These would be: increased security, future reliability, rewarding consumers, and lower emissions. The report ultimately recommended a
Clean Energy Target
(CET) to provide incentives for growth in renewable energies.
[46]
The reaction to the report by scientific experts in the field leaned more towards positive. Positive reactions to the Report were due to the national strategy plan that provides a CET for Australia, creating customer incentives, and takes politics out of energy policy to help meet the Paris Agreement. Additionally, the Finkel Report was commended for recognizing the current technologies available and including market forces in its solutions by the
Australian Academy of Technology Engineering
.
[47]
National Energy Guarantee
[
edit
]
On 17 October 2017, the Australian Government rejected Finkel's CET proposal, in favour of what it called the
National Energy Guarantee
(NEG), to reduce power prices and prevent blackouts. The strategy calls on electricity retailers to meet separate reliability and emissions requirements, rather than Dr Finkel's CET recommendation. Under the plan, retailers have to provide a minimum amount of baseload power from coal, gas or hydro, while also providing a specified level of low emissions energy.
[48]
NEG has been criticised as turning away from renewable energy.
[49]
In October 2018, the Australian Government announced that it would not continue with the Guarantee.
[50]
[51]
Carbon tax
[
edit
]
On 1 July 2012, the Australian Federal government introduced a
carbon tax
of
A$
23 (
US$
17.29) per tonne on selected fossil fuels consumed by major industrial emitters and government bodies such as councils. To offset the tax, the government reduced income tax (by increasing the tax-free threshold) and increased pensions and welfare payments slightly, while introducing compensation for some affected industries. On 17 July 2014, a report by the
Australian National University
estimated that the Australian scheme had cut carbon emissions by as much as 17 million tonnes. The tax notably helped reduce pollution from the electricity sector.
[52]
On 17 July 2014, the
Abbott government
passed repeal legislation through the Senate, and Australia became the first nation to abolish a carbon tax.
[53]
In its place, the government set up the Emission Reduction Fund.
[54]
See also
[
edit
]
Notes
[
edit
]
- ^
a
b
These figures are rounded to the nearest 100 persons
References
[
edit
]
- ^
"Australia 2023 ? Analysis"
.
IEA
. 19 April 2023
. Retrieved
11 March
2024
.
- ^
"Australia Country Analysis Brief"
. 2002.
Archived
from the original on 2 April 2016
. Retrieved
19 October
2016
.
- ^
"New Zealand says goodbye to coal power"
.
antinuclear.net
. 7 August 2015
. Retrieved
26 November
2015
.
- ^
"China starts moving away from coal based energy"
.
Spokesman.com
. 13 September 2013
. Retrieved
26 November
2015
.
- ^
Clean Energy Council Australia.
"Clean Energy Australia Report 2023"
(PDF)
.
Clean Energy Australia
. Retrieved
1 May
2023
.
- ^
a
b
"Australian Energy Statistics | energy.gov.au"
.
www.energy.gov.au
. Retrieved
8 August
2020
.
- ^
"The World's Biggest Polluters"
.
The New Ecologist
. 15 October 2009
. Retrieved
19 April
2018
.
- ^
Energy, Department of the Environment and (26 July 2017).
"Department of the Environment and Energy"
.
Department of the Environment and Energy
. Retrieved
7 September
2017
.
- ^
IEA Key energy statistics 2010
Archived
11 October 2010 at the
Wayback Machine
Pages: 15
- ^
IEA Key energy statistics 2010
Archived
11 October 2010 at the
Wayback Machine
Pages:15
- ^
IEA Key World Energy Statistics 2016
(PDF)
. International Energy Agency. 2016. p. 15.
- ^
"Key Coal Trends. Excerpt from: Coal information"
(PDF)
.
Information Energy Agency (IEA)
. 1 January 2016
. Retrieved
12 September
2017
.
- ^
a
b
c
d
e
f
"Australia 2023 - Energy Policy Review"
(PDF)
.
International Energy Agency
. 2023.
- ^
"Australian Energy Statistics"
.
- ^
a
b
OECD/IEA, pp. 131?137
- ^
Stephen McDonell, 19 August 2009,
Record gas deal between China and Australia ? AM
? Australian Broadcasting Corporation
- ^
Babs McHugh, 19 August 2009,
Massive sale from Gorgon Gas Project
? Australian Broadcasting Corporation
- ^
David McLennan, 20 August 2009,
Australia to be 'global supplier of clean energy'
Archived
18 September 2009 at the
Wayback Machine
? The Canberra Times
- ^
Peter Ryan, 19 August 2009,
Deal means 2.2 million tonnes exported per year ? AM
? Australian Broadcasting Corporation
- ^
a
b
Australia: Energy profile
Archived
1 October 2011 at the
Wayback Machine
26 June 2007, Energy Publisher accessdate 3 July 2011
- ^
Shale oil. AIMR Report 2006
Geoscience Australia, accessdate=30 May 2007
[1]
archivedate 13 February 2007
- ^
Climate-changing shale oil industry stopped
Archived
28 November 2007 at the
Wayback Machine
Greenpeace Australia Pacific, 3 March 2005, accessdate 28 June 2007
- ^
"Uranium Supplies: Supply of Uranium - World Nuclear Association"
.
- ^
"State of the energy market, 2020 | Australian Energy Regulator"
.
www.aer.gov.au
. Retrieved
11 July
2017
.
Comparable to previous years statistical calculation criteria,
2018
,
2017
,
2015
,
2014
,
2013
,
2012
,
2011
, and
2010
- ^
http://www.genifoundation.org.au/images/Energy_Grid_Aust_2009_April_m.jpg
[
bare URL image file
]
- ^
(22 May 2011).
Carbon tax is delaying investment: McIndoe
. Inside Business. Australian Broadcasting Corporation. Retrieved on 12 March 2012.
- ^
Royce Millar & Adam Morton (21 May 2011).
Big banks 'no' to coal plant
.
The Age
. Fairfax Media. Retrieved on 12 March 2012.
- ^
Mark, David (8 August 2014).
"Australia faces unprecedented oversupply of energy, no new energy generation needed for 10 years: report"
.
ABC
. Retrieved
7 September
2017
.
- ^
"Energy Supply Outlook"
(PDF)
. AEMO
. Retrieved
7 September
2017
.
- ^
Swoboda, Kai.
"Energy prices?the story behind rising costs"
.
Parliament of Australia
. Retrieved
12 September
2017
.
- ^
"Clean Energy Australia Report 2023"
. 17 April 2023.
- ^
scheme (2012).
Energy Council
[
permanent dead link
]
- ^
"Wind Farm Investment, Employment and Carbon Abatement in Australia"
(PDF)
. Archived from
the original
(PDF)
on 19 April 2013
. Retrieved
10 October
2012
.
- ^
"Australia tipped to add 70,000 home batteries in 2019, lead global demand"
. 11 February 2019.
- ^
"Australia's largest solar farm opens amid renewable target debate"
.
The Guardian
. 10 October 2012.
The Greenough River Solar project in Western Australia is expected to have enough capacity to power 3,000 homes.
- ^
Energy in Sweden 2010
Archived
16 October 2013 at the
Wayback Machine
, Table 1: Emissions of carbon dioxide in total, per capita and per GDP in EU and OECD countries, 2007
- ^
Which nations are really responsible for climate change - interactive map
The Guardian
8 December 2011 (All goods and services consumed, source: Peters et al PNAS, 2011)
- ^
Head, Lesley; Adams, Michael; McGregor, Helen V.; Toole, Stephanie (1 March 2014).
"Climate change and Australia"
.
Wiley Interdisciplinary Reviews: Climate Change
.
5
(2): 175?197.
Bibcode
:
2014WIRCC...5..175H
.
doi
:
10.1002/wcc.255
.
ISSN
1757-7799
.
S2CID
131481369
.
- ^
Energy, Department of the Environment and (2 June 2014).
"Department of the Environment and Energy"
.
Department of the Environment and Energy
. Retrieved
7 September
2017
.
- ^
Australian Bureau of Statistics
;
Statistics New Zealand
(2006).
Australian and New Zealand Standard Industrial Classification 2006 (ANZSIC)
(PDF)
(Report). Australian Bureau of Statistics. p. 200.
- ^
"Electricity, Gas, Water, Waste Services"
.
Job Outlook
. Retrieved
22 December
2017
.
- ^
a
b
c
Australian Bureau of Statistics
(2017).
6291.0.55.003 - Labour Force, Australia, Detailed, Quarterly, Nov 2017, Table 06. Employed persons by Industry sub-division of main job (ANZSIC) and Sex
(Report). Australian Bureau of Statistics.
- ^
Department of Employment, Australian Government
(2016).
4. Main Employing Occupations
(Report). Department of Employment, Australian Government.
- ^
a
b
c
Australian Bureau of Statistics
(2017).
4631.0 - Employment in Renewable Energy Activities, Australia, 2015-16
(Report). Australian Bureau of Statistics.
- ^
a
b
Climate Council of Australia
(2016).
Renewable Energy Jobs: Future Growth in Australia
(PDF)
. Climate Council of Australia.
ISBN
978-0-9945973-3-5
.
- ^
Finkel, Alan.
"Independent Review into the Future Security of the National Electricity Market"
(PDF)
.
Department of the Environment and Energy
. Commonwealth of Australia
. Retrieved
12 September
2017
.
- ^
SCIMEX (9 June 2017).
"EXPERT REACTION: Finkel Report - Independent Review into the Future Security of the National Electricity Market"
.
Scimex
. Retrieved
12 September
2017
.
- ^
Government ditches chief scientist's energy plan, but Alan Finkel backs the new one
- ^
"Australia rejects chief scientist's clean energy proposal"
.
BBC
. 17 October 2017
. Retrieved
17 October
2017
.
- ^
Mills, Chanel (16 October 2017).
"National Energy Guarantee"
.
www.coagenergycouncil.gov.au
. Retrieved
11 January
2020
.
- ^
staff, The Guardian (8 September 2018).
"Scott Morrison says national energy guarantee 'is dead'
"
.
The Guardian
.
ISSN
0261-3077
. Retrieved
11 January
2020
.
- ^
Peter, Hannam.
"Carbon price helped curb emissions, ANU study finds"
.
The Guardian
. Archived from
the original
on 26 July 2014
. Retrieved
17 July
2014
.
- ^
Cox, Lisa.
"Carbon tax is gone: Repeal bills pass the Senate"
.
The Guardian
. Archived from
the original
on 26 July 2014
. Retrieved
17 July
2014
.
- ^
Hannam, Peter (13 June 2014).
"Fall in greenhouse gas emissions biggest in 24 years"
Archived
19 November 2021 at the
Wayback Machine
.
The Sydney Morning Herald
.
|
|---|
|
Fossil fuel
industry
| |
|---|
Renewable energy
industry
| |
|---|
Policies and
targets
| |
|---|
| Nuclear power
| |
|---|
| Agencies
| |
|---|
| Research
| |
|---|
|
|
|---|
| History
| |
|---|
| Currency
| |
|---|
| State economies
| |
|---|
| Industries
| |
|---|
| Taxation
| |
|---|
| Banking and Finance
| |
|---|
| Regulatory agencies
| |
|---|
| Energy
| |
|---|
| Economic conditions
| |
|---|
| Unions
| |
|---|
| Trade agreements
| |
|---|
|