| U.S. cities with significant Chinese-American populations
|
|---|
|
 |
|
|
Cities considered to have significant
Chinese-American
populations are large U.S. cities or municipalities with a critical mass of at least 1% of the total urban population; medium-sized cities with a critical mass of at least 1% of their total population; and small cities with a critical mass of at least 10% of the total population.
According to the 2012 Census estimates,
[7]
the three
metropolitan areas
with the largest Chinese-American populations were the
Greater New York
Combined Statistical Area
at 735,019 people, the
San Jose-San Francisco-Oakland
Combined Statistical Area at 629,243 people, and the
Greater Los Angeles
Combined Statistical Area at about 566,968 people. In the post-1965 era, first- and second-generation immigrants include those from
Mainland China
,
Hong Kong
,
Macau
, and
Taiwan
. Also included in the Chinese-American population enumeration are
ethnic Chinese from Malaysia
and
Vietnam
who might identify themselves as Chinese, thus skewing the census reporting.
New York City
is home to by far the highest Chinese-American population of any city proper, with an estimated 573,388
Chinese-Americans in New York City
,
[1]
significantly higher than the total of the next five cities combined; multiple large Chinatowns in
Manhattan
,
Brooklyn
(three), and
Queens
(three) are thriving as traditionally urban enclaves, as large-scale
Chinese immigration
continues into New York,
[8]
[9]
[10]
[11]
with the
largest metropolitan Chinese population
outside
Asia
.
[12]
The Los Angeles County city of
Monterey Park
has the highest percentage of Chinese-Americans of any municipality, at 43.7% of its population, or 24,758 people. The
San Gabriel Valley
region of
Los Angeles County
is the single largest concentration of combined Chinese and Taiwanese Americans in the country,
[13]
having a collections of U.S. suburbs with large foreign-born Chinese-speaking populations, ranging from working-class individuals residing in
Rosemead
and
El Monte
to wealthier immigrants living in
Arcadia
,
San Marino
, and
Diamond Bar
. A similar demographic shift has also taken place in the southern half of the
San Francisco Bay Area
. Conversely, the
suburbs of New York City
within the state of
New Jersey
are notable for their widespread and increasing prevalence of Chinese-Americans (see list below), reflecting their general affluence and propensity for
professional
occupation.
Metropolitan areas with more than 20,000 Chinese-Americans
[
edit
]
The list of metropolitan areas with a
Chinese-American
population of 20,000 or more as of the 2011-2015 American Community Survey
[update]
.
| Rank
|
MSA
|
Region
|
Chinese-Americans
|
Percentage
|
| 1
|
New York-Newark-Jersey City
|
Mid-Atlantic
|
739,144
|
3.7
|
| 2
|
Los Angeles-Long Beach-Anaheim
|
Pacific
|
528,248
|
4.0
|
| 3
|
San Francisco-Oakland-Hayward
|
Pacific
|
460,252
|
10.2
|
| 4
|
San Jose-Sunnyvale-Santa Clara
|
Pacific
|
169,026
|
8.8
|
| 5
|
Boston-Cambridge-Newton
|
New England
|
133,241
|
2.8
|
| 6
|
Chicago-Naperville-Elgin
|
East North Central
|
109,046
|
1.1
|
| 7
|
Washington-Arlington-Alexandria
|
South Atlantic
|
105,462
|
1.8
|
| 8
|
Seattle-Tacoma-Bellevue
|
Pacific
|
98,949
|
2.7
|
| 9
|
Houston-The Woodlands-Sugar Land
|
West South Central
|
86,246
|
1.4
|
| 10
|
Philadelphia-Camden-Wilmington
|
Mid-Atlantic
|
82,487
|
1.4
|
| 11
|
Sacramento-Roseville-Arden-Arcade
|
Pacific
|
61,203
|
2.8
|
| 12
|
Dallas-Fort Worth-Arlington
|
West South Central
|
57,325
|
0.8
|
| 13
|
San Diego-Carlsbad
|
Pacific
|
56,751
|
1.8
|
| 14
|
Urban Honolulu
|
Pacific
|
53,119
|
5.4
|
| 15
|
Riverside-San Bernardino-Ontario
|
Pacific
|
51,628
|
1.2
|
| 16
|
Atlanta-Sandy Springs-Roswell
|
South Atlantic
|
46,859
|
0.8
|
| 17
|
Miami-Fort Lauderdale-West Palm Beach
|
South Atlantic
|
34,210
|
0.6
|
| 18
|
Portland-Vancouver-Hillsboro
|
Pacific
|
31,533
|
1.4
|
| 19
|
Las Vegas-Henderson-Paradise
|
Pacific
|
30,329
|
1.5
|
| 20
|
Phoenix-Mesa-Scottsdale
|
Mountain
|
28,550
|
0.6
|
| 21
|
Minneapolis-St. Paul-Bloomington
|
West North Central
|
24,721
|
0.7
|
| 22
|
Detroit-Warren-Dearborn
|
East North Central
|
24,524
|
0.6
|
| 23
|
Baltimore-Columbia-Towson
|
South Atlantic
|
24,092
|
0.9
|
| 24
|
Austin-Round Rock
|
West South Central
|
20,182
|
1.1
|
Large-sized cities
[
edit
]
The list of large cities (population greater than 250,000) with a
Chinese-American
population of at least 1% of the total population, as of the 2011-2016 American Community Survey
[update]
.
| Rank
|
City
|
State
|
Chinese-Americans
|
Percentage
|
| 1
|
San Francisco
[n 1]
|
California
|
180,372
|
21.2
|
| 2
|
Irvine
|
California
|
34,022
|
13.8
|
| 3
|
Oakland
|
California
|
34,106
|
8.3
|
| 4
|
San Jose
|
California
|
75,582
|
7.5
|
| 5
|
New York
[n 2]
|
New York
|
562,205
|
6.6
|
| 6
|
Plano
|
Texas
|
14,822
|
5.3
|
| 7
|
Honolulu
[n 3]
|
Hawaii
|
51,149
|
5.2
|
| 8
|
Boston
|
Massachusetts
|
30,097
|
4.6
|
| 9
|
Seattle
|
Washington
|
30,223
|
4.5
|
| 10
|
Sacramento
|
California
|
21,691
|
4.5
|
| 11
|
Jersey City
|
New Jersey
|
8,420
|
3.3
|
| 12
|
San Diego
|
California
|
43,715
|
3.2
|
| 13
|
Fairfax
[n 4]
|
Virginia
|
28,806
|
2.5
|
| 14
|
Philadelphia
[n 5]
|
Pennsylvania
|
35,451
|
2.3
|
| 15
|
Pittsburgh
|
Pennsylvania
|
6,677
|
2.2
|
| 16
|
Stockton
|
California
|
6,226
|
2.1
|
| 17
|
Portland
|
Oregon
|
12,222
|
2.0
|
| 18
|
Los Angeles
|
California
|
77,073
|
2.0
|
| 19
|
Chicago
|
Illinois
|
52,917
|
1.9
|
| 20
|
Austin
|
Texas
|
15,170
|
1.7
|
| 21
|
Durham
|
North Carolina
|
3,990
|
1.6
|
| 22
|
Houston
|
Texas
|
34,088
|
1.5
|
| 23
|
Riverside
|
California
|
4,491
|
1.4
|
| 24
|
Anaheim
|
California
|
4,908
|
1.4
|
| 25
|
Columbus
|
Ohio
|
9,788
|
1.2
|
| 26
|
Henderson
|
Nevada
|
3,329
|
1.2
|
| 27
|
Raleigh
|
North Carolina
|
4,692
|
1.1
|
| 28
|
Lexington
[n 6]
|
Kentucky
|
3,078
|
1.0
|
| 29
|
Washington
[n 7]
|
District of Columbia
|
6,345
|
1.0
|
| 30
|
Long Beach
|
California
|
4,527
|
1.0
|
New York City boroughs
[
edit
]
The busy intersection of
Main Street
,
Kissena Boulevard
, and 41st Avenue in the
Flushing Chinatown (法拉盛華埠)
,
Queens
,
New York City
, the Chinese "
Times Square
". The segment of Main Street between Kissena Boulevard and
Roosevelt Avenue
, punctuated by the
Long Island Rail Road
trestle
overpass, represents the cultural heart of Flushing Chinatown. Housing over 30,000 individuals born in China alone, the largest by this metric outside Asia,
Flushing
has become home to the largest and one of the fastest-growing Chinatowns in the world.
[14]
Approximately 250,000 Chinese live in the Queens
borough of New York City
.
As the city proper with the nation's largest Chinese-American population by a wide margin, with an estimated 562,205 in 2016 by the 2010-2016 American Community Survey, and as the primary destination for
new Chinese immigrants
,
[3]
New York City is subdivided into official municipal
boroughs
, which themselves are home to significant Chinese populations, with
Brooklyn
and
Queens
, adjacently located on
Long Island
, leading the fastest growth.
[15]
[16]
After the City of New York itself, the boroughs of Queens and Brooklyn encompass the largest Chinese populations, respectively, of all municipalities in the United States.
Medium-sized cities
[
edit
]
List of medium-sized cities (population between 100,000 and 250,000) with a Chinese-American population of at least one percent of the total population, according to the American Community Survey.
| 2010-2016
|
| Rank
|
City
|
State
|
Chinese-Americans
|
Percentage
|
|
|
Daly City
|
California
|
20,048
|
19.0
|
|
|
Fremont
|
California
|
40,752
|
17.9
|
|
|
El Monte
|
California
|
20,190
|
17.5
|
|
|
Sunnyvale
|
California
|
19,395
|
13.0
|
|
|
Bellevue
|
Washington
|
15,804
|
11.6
|
|
|
West Covina
|
California
|
12,193
|
11.3
|
|
|
Berkeley
|
California
|
10,094
|
8.5
|
|
|
Elk Grove
|
California
|
10,758
|
6.6
|
|
|
Cambridge
|
Massachusetts
|
7,404
|
6.8
|
|
|
Pasadena
|
California
|
8,867
|
6.3
|
|
|
Ann Arbor
|
Michigan
|
7,998
|
6.8
|
|
|
Torrance
|
California
|
7,696
|
5.2
|
|
|
Spring Valley
|
Nevada
|
10,927
|
5.7
|
|
|
Richmond
|
California
|
5,523
|
5.1
|
|
|
Enterprise
|
Nevada
|
5,879
|
4.5
|
|
|
Hayward
|
California
|
6,930
|
4.5
|
|
|
Naperville
|
Illinois
|
6,584
|
4.5
|
|
|
Fullerton
|
California
|
5,328
|
3.8
|
|
|
Richardson
|
Texas
|
4,646
|
4.3
|
|
|
College Station
|
Texas
|
4,079
|
3.9
|
|
|
Thousand Oaks
|
California
|
3,889
|
3.0
|
|
|
Rancho Cucamonga
|
California
|
5,778
|
3.3
|
|
|
Cary
|
North Carolina
|
5,283
|
3.4
|
|
|
Pomona
|
California
|
4,867
|
3.2
|
|
|
Jersey City
|
New Jersey
|
8,420
|
3.2
|
|
|
Concord
|
California
|
3,607
|
2.8
|
|
|
Madison
|
Wisconsin
|
6,899
|
2.8
|
|
|
Tempe
|
Arizona
|
4,361
|
2.5
|
|
|
New Haven
|
Connecticut
|
2,635
|
2.0
|
|
|
Kent
|
Washington
|
3,273
|
2.6
|
|
|
Antioch
|
California
|
2,342
|
2.2
|
|
|
Chandler
|
Arizona
|
5,273
|
2.2
|
|
|
Orange
|
California
|
2,729
|
2.0
|
|
|
Columbia
|
Missouri
|
2,765
|
2.4
|
|
|
Arlington
[n 8]
|
Virginia
|
4,827
|
2.1
|
|
|
Huntington Beach
|
California
|
3,925
|
2.0
|
|
|
Boulder
|
Colorado
|
2,376
|
2.3
|
|
|
Gainesville
|
Florida
|
2,358
|
1.8
|
|
|
Glendale
|
California
|
3,818
|
1.9
|
|
|
Durham
|
North Carolina
|
3,990
|
1.6
|
|
|
Garden Grove
|
California
|
3,032
|
1.7
|
|
|
Stamford
|
Connecticut
|
1,884
|
1.5
|
|
|
Salt Lake City
|
Utah
|
3,037
|
1.6
|
|
|
Eugene
|
Oregon
|
2,487
|
1.6
|
|
|
Syracuse
|
New York
|
2,351
|
1.6
|
|
|
Norwalk
|
California
|
1,719
|
1.6
|
|
|
Providence
|
Rhode Island
|
2,647
|
1.5
|
|
|
Frisco
|
Texas
|
2,077
|
1.5
|
|
|
Miramar
|
Florida
|
1,993
|
1.5
|
|
|
Norman
|
Oklahoma
|
1,751
|
1.5
|
|
|
Carlsbad
|
California
|
1,701
|
1.5
|
|
|
Overland Park
|
Kansas
|
2,450
|
1.4
|
|
|
Costa Mesa
|
California
|
1,584
|
1.4
|
|
|
Rochester
|
Minnesota
|
1,507
|
1.4
|
|
|
Burbank
|
California
|
1,473
|
1.4
|
|
|
Simi Valley
|
California
|
1,606
|
1.3
|
|
|
Fairfield
|
California
|
1,407
|
1.3
|
|
|
Carrollton
|
Texas
|
1,605
|
1.3
|
|
|
Worcester
|
Massachusetts
|
2,311
|
1.3
|
|
|
Roseville
|
California
|
1,633
|
1.3
|
|
|
Corona
|
California
|
1,952
|
1.2
|
|
|
Vallejo
|
California
|
1,422
|
1.2
|
|
|
Vancouver
|
Washington
|
1,881
|
1.1
|
|
|
Fort Collins
|
Colorado
|
1,666
|
1.1
|
|
|
Denton
|
Texas
|
1,384
|
1.1
|
|
|
Pearland
|
Texas
|
1,112
|
1.1
|
|
|
Garland
|
Texas
|
2,278
|
1.0
|
|
|
Baton Rouge
|
Louisiana
|
2,207
|
1.0
|
|
|
Athens
|
Georgia
|
1,982
|
1.0
|
| 2005-2009
|
| Rank
|
City
|
State
|
Chinese-Americans
|
Percentage
|
| 1
|
Fremont
|
California
|
34,678
|
17.3
|
| 2
|
Daly City
|
California
|
13,359
|
13.3
|
| 3
|
El Monte
|
California
|
15,339
|
12.7
|
| 4
|
Irvine
|
California
|
24,233
|
12.3
|
| 5
|
Sunnyvale
|
California
|
14,777
|
11.3
|
| 6
|
Bellevue
|
Washington
|
10,928
|
9.6
|
| 7
|
Berkeley
|
California
|
7,585
|
7.4
|
| 8
|
Cambridge
|
Massachusetts
|
5,772
|
5.4
|
| 9
|
Torrance
|
California
|
6,887
|
4.9
|
| 10
|
Pasadena
|
California
|
6,084
|
4.3
|
| 11
|
Ann Arbor
|
Michigan
|
6,364
|
5.6
|
| 12
|
Naperville
|
Illinois
|
5,399
|
3.8
|
| 13
|
Richardson
|
Texas
|
3,274
|
3.3
|
| 14
|
Thousand Oaks
|
California
|
3,794
|
3.0
|
| 15
|
Everett
|
Washington
|
|
2.5
|
| 16
|
Concord
|
California
|
2,960
|
2.4
|
| 17
|
Cary
|
North Carolina
|
2,128
|
2.3
|
| 18
|
Madison
|
Wisconsin
|
4,617
|
2.0
|
| 19
|
Huntington Beach
|
California
|
3,804
|
2.0
|
| 20
|
Tempe
|
Arizona
|
3,413
|
2.0
|
| 21
|
Champaign
|
Illinois
|
|
1.8
|
| 22
|
Chandler
|
Arizona
|
4,131
|
1.7
|
| 23
|
Stamford
|
Connecticut
|
1,998
|
1.7
|
| 24
|
Jersey City
|
New Jersey
|
3,600
|
1.5
|
| 25
|
Columbia
|
Missouri
|
1,454
|
1.5
|
| 26
|
Arlington
|
Virginia
|
2,837
|
1.4
|
| 27
|
Salt Lake City
|
Utah
|
3,600
|
1.3
|
| 28
|
Glendale
|
California
|
2,519
|
1.3
|
| 29
|
Eugene
|
Oregon
|
1,908
|
1.3
|
| 30
|
Simi Valley
|
California
|
1,609
|
1.3
|
| 31
|
Pembroke Pines
|
Florida
|
1,861
|
1.3
|
| 32
|
Overland Park
|
Kansas
|
2,035
|
1.2
|
| 33
|
Durham
|
North Carolina
|
2,004
|
1.1
|
| 34
|
Irving
|
Texas
|
2,157
|
1.1
|
| 35
|
Providence
|
Rhode Island
|
1,867
|
1.1
|
| 36
|
Syracuse
|
New York
|
1,542
|
1.1
|
| 37
|
Roseville
|
California
|
1,227
|
1.0
|
| 38
|
Carrollton
|
Texas
|
1,223
|
1.0
|
| 39
|
Syosset
|
New York
|
1,642
|
1.0
|
| 40
|
Garland
|
Texas
|
2,174
|
1.0
|
| 41
|
Reno
|
Nevada
|
2,128
|
1.0
|
| 42
|
Gilbert
|
Arizona
|
2,042
|
1.0
|
| 43
|
Worcester
|
Massachusetts
|
1,849
|
1.0
|
| 44
|
Santa Rosa
|
California
|
1,613
|
1.0
|
Small-sized cities
[
edit
]
The following is a list of places in the United States with a population fewer than 100,000 in which at least three percent (five percent in Los Angeles or San Francisco Bay areas) of the total population is Chinese, according to the 2010-2015 American Community Survey, and the
2010 U.S. Census
for the
U.S. territories
.
American Samoa
[
edit
]
California
[
edit
]
- Greater Los Angeles Area
The majority of the Chinese-American population of more than 400,000 in
Los Angeles County
lives within the
San Gabriel Valley
, which is particularly noted for cities that have a large Chinese-American ethnic plurality. The following cities have the highest percentage of Chinese-Americans in
Greater Los Angeles
.
| 2010-2015
|
| Rank
|
City
|
County
|
Chinese-Americans
|
Percentage
|
| 1
|
Arcadia
|
Los Angeles
|
26,229
|
45.6
|
| 2
|
Monterey Park
|
Los Angeles
|
27,244
|
44.6
|
| 3
|
Temple City
|
Los Angeles
|
15,741
|
43.6
|
| 4
|
San Marino
|
Los Angeles
|
5,766
|
43.3
|
| 5
|
San Gabriel
|
Los Angeles
|
16,893
|
42.0
|
| 6
|
East San Gabriel
|
Los Angeles
|
6,109
|
38.2
|
| 7
|
Alhambra
|
Los Angeles
|
30,683
|
36.2
|
| 8
|
Rowland Heights
|
Los Angeles
|
18,276
|
36.2
|
| 9
|
Rosemead
|
Los Angeles
|
19,480
|
35.7
|
| 10
|
Walnut
|
Los Angeles
|
10,296
|
34.4
|
| 11
|
Hacienda Heights
|
Los Angeles
|
15,127
|
27.4
|
| 12
|
Diamond Bar
|
Los Angeles
|
15,203
|
26.9
|
| 13
|
North El Monte
|
Los Angeles
|
1,072
|
26
|
| 14
|
South San Gabriel
|
Los Angeles
|
1,941
|
21.8
|
| 15
|
Mayflower Village
|
Los Angeles
|
1,162
|
21.4
|
| 16
|
East Pasadena
|
Los Angeles
|
1,019
|
16.8
|
| 17
|
Bradbury
|
Los Angeles
|
139
|
16.6
|
| 18
|
Cerritos
|
Los Angeles
|
6,999
|
14.1
|
| 19
|
South Pasadena
|
Los Angeles
|
3,432
|
13.2
|
| 20
|
Chino Hills
|
San Bernardino
|
8,917
|
11.6
|
| 21
|
La Habra Heights
|
Los Angeles
|
563
|
10.4
|
| 22
|
San Pasqual
|
Los Angeles
|
185
|
9.3
|
| 23
|
Rancho Palos Verdes
|
Los Angeles
|
3,905
|
9.2
|
| 24
|
Eastvale
|
Riverside
|
5,071
|
9.0
|
| 25
|
Palos Verdes Estates
|
Los Angeles
|
1,203
|
8.8
|
| 26
|
Artesia
|
Los Angeles
|
1,324
|
7.9
|
| 27
|
Baldwin Park
|
Los Angeles
|
5,951
|
7.8
|
| 28
|
Claremont
|
Los Angeles
|
2,649
|
7.4
|
| 29
|
Rolling Hills
|
Los Angeles
|
133
|
7.3
|
| 30
|
Monrovia
|
Los Angeles
|
2,623
|
7.1
|
| 31
|
Rolling Hills Estates
|
Los Angeles
|
567
|
6.9
|
| 32
|
Sierra Madre
|
Los Angeles
|
744
|
6.7
|
| 33
|
La Palma
|
Orange
|
1,023
|
6.5
|
| 34
|
Oak Park
|
Ventura
|
950
|
6.3
|
| 35
|
San Dimas
|
Los Angeles
|
2,015
|
5.9
|
| 36
|
Duarte
|
Los Angeles
|
1,211
|
5.6
|
| 37
|
Cypress
|
Orange
|
2,680
|
5.5
|
| 38
|
Avocado Heights
|
Los Angeles
|
861
|
5.4
|
| 39
|
Montebello
|
Los Angeles
|
3,377
|
5.3
|
| 40
|
South El Monte
|
Los Angeles
|
1,040
|
5.1
|
| 41
|
Yorba Linda
|
Orange
|
3,352
|
5.0
|
| 42
|
Fountain Valley
|
Orange
|
2,819
|
5.0
|
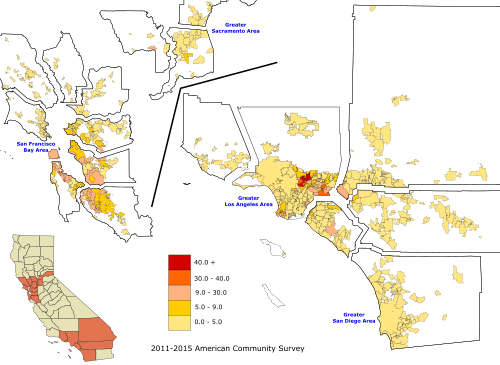
- San Francisco Bay Area
Traditionally centered in San Francisco and Chinatown Oakland, the suburbanization of the
Bay Area
's Chinese-American population has resulted in significant concentrations in the southwestern
East Bay
, eastern
Peninsula
, and northern
Santa Clara County
. Chinese enclaves have also formed in many of these cities, in a similar manner to that of Southern California's San Gabriel Valley.
| 2010-2015
|
| Rank
|
City
|
County
|
Chinese-Americans
|
Percentage
|
| 1
|
Millbrae
|
San Mateo
|
7,198
|
32.1
|
| 2
|
Cupertino
|
Santa Clara
|
16,836
|
28.0
|
| 3
|
Camino Tassajara
|
Contra Costa
|
620
|
27.6
|
| 4
|
Foster City
|
San Mateo
|
7,361
|
22.7
|
| 5
|
Saratoga
|
Santa Clara
|
6,977
|
22.6
|
| 6
|
Highlands-Baywood Park
|
San Mateo
|
934
|
22.1
|
| 7
|
Hillsborough
|
San Mateo
|
2,201
|
19.6
|
| 8
|
Broadmoor
|
San Mateo
|
1,026
|
19.0
|
| 9
|
Palo Alto
|
Santa Clara
|
10,500
|
15.8
|
| 10
|
Los Altos Hills
|
Santa Clara
|
1,270
|
15.3
|
| 11
|
San Leandro
|
Alameda
|
12,844
|
14.6
|
| 12
|
Albany
|
Alameda
|
2,810
|
14.6
|
| 13
|
Loyola
|
Santa Clara
|
506
|
14.3
|
| 14
|
Stanford
|
Santa Clara
|
2,018
|
14.2
|
| 15
|
Alameda
|
Alameda
|
10,790
|
14.1
|
| 16
|
Milpitas
|
Santa Clara
|
9,847
|
13.8
|
| 17
|
Los Altos
|
Santa Clara
|
4,014
|
13.3
|
| 18
|
Piedmont
|
Alameda
|
1,425
|
12.8
|
| 19
|
Castro Valley
|
Alameda
|
7,385
|
11.9
|
| 20
|
San Ramon
|
Contra Costa
|
8,708
|
11.7
|
| 21
|
Mountain View
|
Santa Clara
|
8,793
|
11.3
|
| 22
|
El Cerrito
|
Contra Costa
|
2,755
|
11.3
|
| 23
|
South San Francisco
|
San Mateo
|
7,332
|
11.1
|
| 24
|
Union City
|
Alameda
|
7,797
|
10.7
|
| 25
|
San Bruno
|
San Mateo
|
4,509
|
10.6
|
| 26
|
Burlingame
|
San Mateo
|
2,961
|
9.9
|
| 27
|
Emeryville
|
Alameda
|
1,060
|
9.8
|
| 28
|
Dublin
|
Alameda
|
5,038
|
9.7
|
| 29
|
Belmont
|
San Mateo
|
2,565
|
9.6
|
| 30
|
San Mateo
|
San Mateo
|
9,408
|
9.3
|
| 31
|
Brisbane
|
San Mateo
|
420
|
9.3
|
| 32
|
San Lorenzo
|
Alameda
|
2,279
|
9.2
|
| 33
|
Moraga
|
Contra Costa
|
1,482
|
8.8
|
| 34
|
Blackhawk
|
Contra Costa
|
798
|
8.6
|
| 35
|
Hercules
|
Contra Costa
|
1,982
|
8.0
|
| 36
|
Fruitdale
|
Santa Clara
|
78
|
8.0
|
| 37
|
Orinda
|
Contra Costa
|
1,433
|
7.7
|
| 38
|
Atherton
|
San Mateo
|
537
|
7.6
|
| 39
|
Pleasanton
|
Alameda
|
5,402
|
7.2
|
| 40
|
Ashland
|
Alameda
|
1,710
|
7.1
|
| 41
|
Pacifica
|
San Mateo
|
2,310
|
6.0
|
| 42
|
Newark
|
Alameda
|
2,522
|
5.7
|
| 43
|
Campbell
|
Santa Clara
|
2,227
|
5.5
|
| 44
|
Colma
|
San Mateo
|
82
|
5.2
|
Delaware
[
edit
]
Georgia
[
edit
]
Guam
[
edit
]
Hawaii
[
edit
]
Indiana
[
edit
]
New Jersey
[
edit
]
Northern Mariana Islands
[
edit
]
Within Saipan, villages with significant Chinese populations include
Garapan
(19.7% Chinese),
Chalan Piao
(18.1% Chinese),
Chalan Kanoa IV
(15.1% Chinese), and
San Antonio
(19.8% Chinese).
[19]
Ohio
[
edit
]
[20]
Texas
[
edit
]
Washington
[
edit
]
The overwhelming majority of these cities are in
King County
, while three others (Edmonds, Lynnwood, and Mill Creek) are in
Snohomish County
. Pullman is in
Whitman County
.
See also
[
edit
]
Notes
[
edit
]
References
[
edit
]
- ^
a
b
"SELECTED POPULATION PROFILE IN THE UNITED STATES - 2014 American Community Survey 1-Year Estimates - New York City - Chinese alone"
. U.S. Census Bureau. Archived from
the original
on February 14, 2020
. Retrieved
September 22,
2015
.
- ^
"Yearbook of Immigration Statistics: 2013 Supplemental Table 2"
. U.S. Department of Homeland Security
. Retrieved
2014-10-01
.
- ^
a
b
"Yearbook of Immigration Statistics: 2012 Supplemental Table 2"
. U.S. Department of Homeland Security
. Retrieved
2014-02-23
.
- ^
"Yearbook of Immigration Statistics: 2011 Supplemental Table 2"
. U.S. Department of Homeland Security
. Retrieved
2014-02-23
.
- ^
John Marzulli (May 9, 2011).
"Malaysian man smuggled illegal Chinese immigrants into Brooklyn using Queen Mary 2: authorities"
. New York: ⓒ Copyright 2012 NY Daily News.com
. Retrieved
2014-02-23
.
- ^
"Chinese New Year 2012 in Flushing"
. QueensBuzz.com. January 25, 2012
. Retrieved
2014-02-23
.
- ^
"ACS DEMOGRAPHIC AND HOUSING ESTIMATES 2012 American Community Survey 1-Year Estimates New York-Newark-Bridgeport, NY-NJ-CT-PA CSA"
. U.S. Census Bureau. Archived from
the original
on 2020-02-12
. Retrieved
2013-10-27
.
- ^
"Yearbook of Immigration Statistics: 2012 Supplemental Table 2"
. U.S. Department of Homeland Security
. Retrieved
2014-02-22
.
- ^
"Yearbook of Immigration Statistics: 2011 Supplemental Table 2"
. U.S. Department of Homeland Security
. Retrieved
2014-02-22
.
- ^
"Yearbook of Immigration Statistics: 2010 Supplemental Table 2"
. U.S. Department of Homeland Security
. Retrieved
2014-02-22
.
- ^
John Marzulli (May 9, 2011).
"Malaysian man smuggled illegal Chinese immigrants into Brooklyn using Queen Mary 2: authorities"
. New York: ⓒ Copyright 2012 NY Daily News.com
. Retrieved
2014-02-22
.
- ^
"Chinese New Year 2012 in Flushing"
. QueensBuzz.com. January 25, 2012
. Retrieved
2014-02-22
.
- ^
"About the San Gabriel Valley"
(PDF)
.
Advancingjustu=ice-la.org
. Retrieved
27 May
2018
.
- ^
Melia Robinson (May 27, 2015).
"This is what it's like in one of the biggest and fastest growing Chinatowns in the world"
. Business Insider.
Archived
from the original on July 30, 2017
. Retrieved
March 3,
2019
.
- ^
"Kings County (Brooklyn Borough), New York QuickLinks"
. U.S. Census Bureau
. Retrieved
2014-03-04
.
- ^
"Queens County (Queens Borough), New York QuickLinks"
. U.S. Census Bureau
. Retrieved
2014-03-04
.
- ^
U.S. Census Bureau. American FactFinder - 2010 summary file [Geography set to "Atu'u village, American Samoa".] URL unavailable.
- ^
U.S. Census Bureau. American FactFinder. 2010 summary file [Geography set to "Tamuning village, Guam" / "Hagatna village, Guam"]. URL unavailable.
- ^
a
b
U.S. Census Bureau. American FactFinder. 2010 summary file [Geography set to "Tinian municipality, Commonwealth of the Northern Mariana Islands" / "Saipan municipality, Commonwealth of the Northern Mariana Islands"]. URL unavailable.
- ^
"American FactFinder - Results"
. Archived from
the original
on 2014-03-05
. Retrieved
2012-11-25
.
Further reading
[
edit
]