Measurement of bodies of water
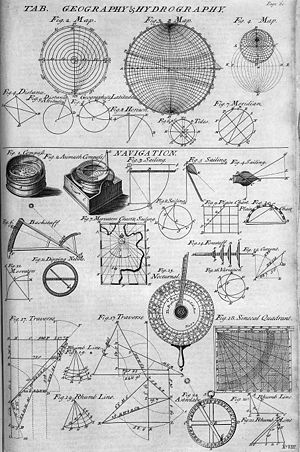 Table of geography, hydrography, and navigation, from a 1728
Cyclopaedia
.
Table of geography, hydrography, and navigation, from a 1728
Cyclopaedia
.
Hydrography
is the branch of applied sciences which deals with the measurement and description of the physical features of
oceans
,
seas
,
coastal areas
,
lakes
and
rivers
, as well as with the prediction of their change over time, for the primary purpose of safety of navigation and in support of all other marine activities, including economic development, security and defense, scientific research, and environmental protection.
[1]
History
[
edit
]
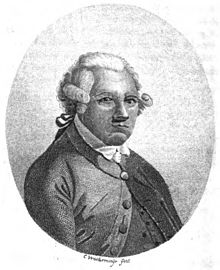 Alexander Dalrymple
, the first
Hydrographer of the Navy
in the
United Kingdom
, appointed in 1795.
Alexander Dalrymple
, the first
Hydrographer of the Navy
in the
United Kingdom
, appointed in 1795.
The origins of hydrography lay in the making of charts to aid navigation, by individual mariners as they navigated into new waters. These were usually the private property, even closely held secrets, of individuals who used them for
commercial
or
military
advantage. As transoceanic trade and exploration increased,
hydrographic surveys
started to be carried out as an exercise in their own right, and the commissioning of surveys was increasingly done by governments and special hydrographic offices. National organizations, particularly
navies
, realized that the collection, systematization and distribution of this knowledge gave it great organizational and military advantages. Thus were born dedicated national hydrographic organizations for the collection, organization, publication and distribution of hydrography incorporated into charts and sailing directions.
Prior to the establishment of the
United Kingdom Hydrographic Office
,
Royal Navy
captains were responsible for the provision of their own charts. In practice this meant that ships often sailed with inadequate information for safe navigation, and that when new areas were surveyed, the data rarely reached all those who needed it. The
Admiralty
appointed
Alexander Dalrymple
as
Hydrographer
in 1795, with a remit to gather and distribute charts to HM Ships. Within a year existing charts from the previous two centuries had been collated, and the first catalogue published.
[2]
The first chart produced under the direction of the
Admiralty
, was a chart of
Quiberon Bay
in
Brittany
, and it appeared in 1800.
Under Captain
Thomas Hurd
the department received its first professional guidelines, and the first catalogues were published and made available to the public and to other nations as well. In 1829, Rear-Admiral
Sir Francis Beaufort
, as Hydrographer, developed the eponymous
Scale
, and introduced the first official
tide tables
in 1833 and the first "
Notices to Mariners
" in 1834. The Hydrographic Office underwent steady expansion throughout the 19th century; by 1855, the Chart Catalogue listed 1,981 charts giving a definitive coverage over the entire world, and produced over 130,000 charts annually, of which about half were sold.
[3]
The word
hydrography
comes from the
Ancient Greek
?δωρ (
hydor
), "water" and γρ?φω (
graph?
), "to write".
Overview
[
edit
]
 Survey of the strategic port of
Milford Haven
produced by
Lewis Morris
in 1748
Survey of the strategic port of
Milford Haven
produced by
Lewis Morris
in 1748
Large-scale hydrography is usually undertaken by national or international organizations which sponsor data collection through precise surveys and publish charts and descriptive material for navigational purposes. The science of oceanography is, in part, an outgrowth of classical hydrography. In many respects the data are interchangeable, but marine hydrographic data will be particularly directed toward marine navigation and safety of that navigation. Marine resource exploration and exploitation is a significant application of hydrography, principally focused on the search for
hydrocarbons
.
Hydrographical measurements include the
tidal
,
current
and
wave
information of physical oceanography. They include
bottom
measurements, with particular emphasis on those marine geographical features that pose a hazard to navigation such as rocks,
shoals
,
reefs
and other features that obstruct
ship
passage. Bottom measurements also include collection of the nature of the bottom as it pertains to effective anchoring. Unlike oceanography, hydrography will include shore features, natural and manmade, that aid in navigation. Therefore, a
hydrographic survey
may include the accurate positions and representations of
hills
,
mountains
and even lights and
towers
that will aid in fixing a ship's position, as well as the physical aspects of the sea and seabed.
Hydrography, mostly for reasons of safety, adopted a number of conventions that have affected its portrayal of the data on nautical charts. For example, hydrographic charts are designed to portray what is safe for navigation, and therefore will usually tend to maintain least
depths
and occasionally de-emphasize the actual submarine
topography
that would be portrayed on
bathymetric charts
. The former are the
mariner
's tools to avoid accident. The latter are best representations of the actual seabed, as in a topographic map, for scientific and other purposes. Trends in hydrographic practice since c. 2003?2005 have led to a narrowing of this difference, with many more
hydrographic offices
maintaining "best observed" databases, and then making navigationally "safe" products as required. This has been coupled with a preference for multi-use surveys, so that the same data collected for nautical charting purposes can also be used for bathymetric portrayal.
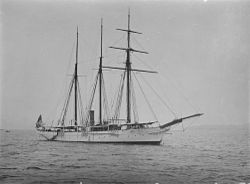 HMS
Waterwitch
, a hydrographic survey vessel
HMS
Waterwitch
, a hydrographic survey vessel
Even though, in places, hydrographic survey data may be collected in sufficient detail to portray bottom topography in some areas,
hydrographic charts
only show depth information relevant for safe navigation and should not be considered as a product that accurately portrays the actual shape of the bottom. The soundings selected from the raw source depth data for placement on the nautical chart are selected for safe navigation and are biased to show predominantly the shallowest depths that relate to safe navigation. For instance, if there is a deep area that can not be reached because it is surrounded by shallow water, the deep area may not be shown. The color filled areas that show different ranges of shallow water are not the equivalent of contours on a topographic map since they are often drawn seaward of the actual shallowest depth portrayed. A bathymetric chart does show marine topology accurately. Details covering the above limitations can be found in Part 1 of
Bowditch's American Practical Navigator
. Another concept that affects safe navigation is the sparsity of detailed depth data from high resolution sonar systems. In more remote areas, the only available depth information has been collected with lead lines. This collection method drops a weighted line to the bottom at intervals and records the depth, often from a rowboat or sail boat. There is no data between soundings or between sounding lines to guarantee that there is not a hazard such as a wreck or a coral head waiting there to ruin a sailor's day. Often, the navigation of the collecting boat does not match today's GPS navigational accuracies. The hydrographic chart will use the best data available and will caveat its nature in a caution note or in the legend of the chart.
A
hydrographic survey
is quite different from a
bathymetric survey
in some important respects, particularly in a bias toward least depths due to the safety requirements of the former and
geomorphologic
descriptive requirements of the latter. Historically, this could include
echosoundings
being conducted under settings biased toward least depths, but in modern practice hydrographic surveys typically attempt to best measure the depths observed, with the adjustments for navigational safety being applied after the fact.
Hydrography of
streams
will include information on the stream bed,
flows
,
water quality
and surrounding land.
Basin
or interior hydrography pays special attention to
rivers
and
potable water
although if collected data is not for ship navigational uses, and is intended for scientific usage, it is more commonly called
hydrometry
or
hydrology
.
Hydrography of rivers and streams is also an integral part of water management. Most reservoirs in the United States use dedicated stream gauging and rating tables to determine inflows into the reservoir and outflows to irrigation districts, water municipalities and other users of captured water. River/stream hydrographers use handheld and bank mounted devices, to capture a sectional flow rate of moving water through a section and or current.
Equipment
[
edit
]
Uncrewed Surface Vessels
(USVs) and are commonly used for hydrographic surveys - they are often equipped with some sort of sonar. Single-beam echosounders,
multibeam echosounders
, and
side scan sonars
are all frequently used in hydrographic applications. The knowledge gained from these surveys aid in disaster planning, port and harbor maintenance, and various other coastal planning activities.
[4]
[5]
Organizations
[
edit
]
Hydrographic services in most countries are carried out by specialised
hydrographic offices
. The international coordination of hydrographic efforts lies with the
International Hydrographic Organization
.
The
United Kingdom Hydrographic Office
is one of the oldest, supplying a wide range of charts covering the globe to other countries, allied military organisations and the public.
In the United States, the hydrographic charting function has been carried out since 1807 by the
Office of Coast Survey
of the
National Oceanic and Atmospheric Administration
within the
U.S. Department of Commerce
and the
U.S. Army Corps of Engineers
.
[6]
[7]
See also
[
edit
]
- Associations focussing on ocean hydrography
- Associations focussing on river stream and lake hydrography
References
[
edit
]
External links
[
edit
]