DNA analyses of people native to the Philippines
Various
genetic studies on
Filipinos
have been performed, to analyze the
population genetics
of the various
ethnic groups in the Philippines
.
The results of a DNA study conducted by the
National Geographic
's "The Genographic Project", based on
genetic testings
of Filipino people by the National Geographic in 2008?2009, found that the Philippines is made up of around 53% Southeast Asia and Oceania, 36% East Asian, 5% European, 3% South Asian and 2% Native American genes.
[1]
Origins
[
edit
]
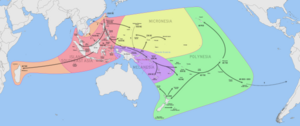 Chronological map of the
Austronesian expansion
[2]
Chronological map of the
Austronesian expansion
[2]
The first
Austronesians
reached the
Philippines
at around 2200 BC, settling the
Batanes Islands
and
northern Luzon
. From there, they rapidly spread downwards to the rest of the islands of the Philippines and
Southeast Asia
, as well as voyaging further east to reach the
Northern Mariana Islands
by around 1500 BC.
[2]
[3]
[4]
They assimilated the older
Negrito
groups which arrived during the
Paleolithic
, resulting in the modern
Filipino ethnic groups
which all display various ratios of
genetic admixture
between Austronesian and Negrito groups.
[5]
A 2008 genetic study by
Leeds University
and published in
Molecular Biology and Evolution
, showed that
mitochondrial DNA
lineages have been evolving within
Maritime Southeast Asia
since modern humans arrived approximately 50,000 years ago. The authors concluded that it was proof that Austronesians evolved within Island Southeast Asia and did not come from Taiwan (the "Out-of-Sundaland" hypothesis). Population dispersals occurred at the same time as sea levels rose, which resulted in migrations from the Philippine Islands into Taiwan within the last 10,000 years.
[6]
However, these have been repudiated by a 2014 study published by
Nature
using
whole genome sequencing
(instead of only mtDNA) which has found that all ISEA populations had genes originating from the aboriginal Taiwanese. Contrary to the claim of a south-to-north migration in the "Out-of-Sundaland" hypothesis, the new whole genome analysis strongly confirms the north-to-south dispersal of the Austronesian peoples in the prevailing "Out-of-Taiwan" hypothesis. The researchers further pointed out that while humans have been living in Sundaland for at least 40,000 years, the Austronesian people were recent arrivals. The results of the 2008 study failed to take into account admixture with the more ancient but unrelated
Negrito
and
Papuan
populations.
[7]
[5]
Another study about the ancestral composition of modern ethnic groups in the Philippines from 2021 similarly suggests that distinctive
Basal-East Asian
(East-Eurasian) ancestry originated in
Mainland Southeast Asia
at ~50,000BC, and expanded through multiple migration waves southwards and northwards respectively. Basal-East Asian ancestry, as well as later Austroasiatic ancestry, from Mainland Southeast Asia, arrived into the Philippines prior to the Austronesian expansion. Austronesian-speakers themself are suggested to have arrived on
Taiwan
and the northern Philippines between 10,000BC to 7,000BC from coastal southern China. The authors concluded that the Austronesian expansion into
Insular Southeast Asia
and
Polynesia
was outgoing from the Philippines rather than Taiwan, and that modern Austronesian-speaking people have largely ancestry from the earliest Basal-East Asians, Austroasiatic migrants from Mainland Southeast Asia, and Austronesian-speaking seafarers from the Philippines. There was also a westward expansion of people from Papua New Guinea to the Philippines as evidenced by Papuan admixture in Blaan and Sangir peoples of Mindanao, as well as immigration from India as detected in the genetics of the Sama-Dilaut people.
[8]
Y-DNA haplogroups
[
edit
]
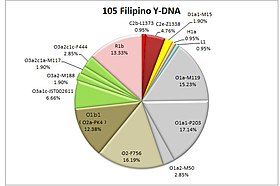 The most common Y-DNA Haplogroup type is O, which Filipinos share with Chinese and fellow Southeast Asians. The South Asian Y-DNA H1a indicate the presence of Indians while the 13% frequency of European Y-DNA R1b is evidence of Spanish immigration.
[9]
[10]
[11]
The most common Y-DNA Haplogroup type is O, which Filipinos share with Chinese and fellow Southeast Asians. The South Asian Y-DNA H1a indicate the presence of Indians while the 13% frequency of European Y-DNA R1b is evidence of Spanish immigration.
[9]
[10]
[11]
 Distribution of Y haplogroup O lineages in East Asia
The most frequently occurring
Y-DNA
haplogroups among modern Filipinos are
haplogroup O1a-M119
, which has been found with maximal frequency among the indigenous peoples of
Nias
, the
Mentawai Islands
, northern
Luzon
, the
Batanes
, and
Taiwan
, and
Haplogroup O2-M122
, which is found with high frequency in many populations of East Asia, Southeast Asia, and
Polynesia
.
In particular, the type of O2-M122 that is found frequently among Filipinos in general, O-P164(xM134), is also found frequently in other Austronesian populations, including
Polynesians
.
[12]
[13]
[14]
Trejaut
et al.
2014 found O2a2b-P164(xO2a2b1-M134) in 26/146 = 17.8% of a pool of samples of Filipinos (4/8 = 50% Mindanao, 7/31 = 22.6% Visayas, 10/55 = 18.2% South Luzon, 1/6 = 17% North Luzon, 2/22 = 9.1% unknown Philippines, 2/24 = 8.3% Ivatan).
The distributions of other subclades of O2-M122 in the Philippines were sporadic, but it may be noted that O2a1b-JST002611 was observed in 6/24 = 25% of a sample of
Ivatan
and 1/31 = 3.2% of a sample from the
Visayas
, O2a2a1a2-M7 was observed in 1/6 = 17% of a sample from North Luzon, 1/55 = 1.8% of a sample from South Luzon, and 1/31 = 3.2% of a sample from the Visayas, and O2a2b1a1a-M133 was observed in 2/31 = 6.5% of a sample from the Visayas.
[13]
A total of 45/146 = 30.8% of the sampled Filipinos were found to belong to Haplogroup O2-M122.
[13]
In a study by Delfin
et al.
(2011), 21.1% (8/38) of a sample of highlanders of northern Luzon (17
Bugkalot
, 12
Kalanguya
, 6
Kankanaey
, 2
Ibaloi
, and 1
Ifugao
) were found to belong to haplogroup O2a2a1a2-M7, which is outside of the O2a2b-P164 clade and is uncommon among
Austronesian
-speaking populations, being rather frequently observed among speakers of
Hmong-Mien
,
Katuic
, and
Bahnaric
languages in southwestern China and eastern Mainland Southeast Asia.
[15]
(Delfin
et al.
also observed O-M7 in 5/39 = 12.8% of a sample of
Agta
from
Iriga
in southeastern Luzon and 5/36 = 13.9% of a sample of
Ati
from
Panay
.
[15]
)
Haplogroup O1a
-M119 is also commonly found among Filipinos (25/146 = 17.1% O1a-M119(xO1a1a-P203, O1a2-M50), 20/146 = 13.7% O1a1a-P203, 17/146 = 11.6% O1a2-M50, 62/146 = 42.5% O1a-M119 total according to Trejaut
et al.
2014) and is shared with other Austronesian-speaking populations, especially those in
Taiwan
, western
Indonesia
, and
Madagascar
.
[16]
R1b Y-DNA common in Spain and Western Europe was also detected among 12-13% of the sample size which had come to the area via immigration from Spain and Latin America, as well as
haplogroup I1
which came from
Germanic Europeans
and had spread to the Philippines from Anglo-America and consisting to about 0.95% of the sample size. Also included is
haplogroup H1a
, that came from South Asian sources.
[9]
[10]
[11]
Haplogroups R-M343 and I-M253
[
edit
]
After the 16th century, the colonial period saw the influx of genetic influence from other populations. This is evidenced by the presence of a small percentage of the Y-DNA
Haplogroup R1b
(R-M343) present among the population of the Philippines. DNA studies vary as to how small these lineages are. A year 2001 study conducted by
Stanford University
Asia-Pacific Research Center
stated that only 3.6% of the Philippine population had European Y-DNA. According to another genetic study done by the
Kaiser Permanente
(KP) Research Program on Genes, Environment, and Health (RPGEH), substantial number of Californian residents self-identifying as Filipinos sampled have "modest" amounts of European ancestry consistent with older admixture.
[17]
The analysis of the full
autosomal
genome of 1,082 individuals from the Philippines has shown that "in contrast to several other Spanish-colonized regions, Philippine demography appears to have remained largely unaffected by admixture with Europeans" (Larena et al. 2021). European admixture is found at a low level among individuals from lowland groups such as
Ilocanos
and
Cebuanos
, and reaches significant population-wide levels among urbanized lowlanders,
Bicolanos
and
Chavacano
-speaking Mestizos.
[18]
Haplogroup Q-M242
[
edit
]
One study found that the Y-DNA of two out of 64 sampled Filipino males belonged to
Haplogroup Q-M242
(which has its highest frequency among
Native Americans
and Asian Siberians and is also found in other Asians).
[19]
Mitochondrial DNA haplogroups
[
edit
]
![[icon]](//upload.wikimedia.org/wikipedia/commons/thumb/1/1c/Wiki_letter_w_cropped.svg/20px-Wiki_letter_w_cropped.svg.png) | This section
needs expansion
. You can help by
adding to it
.
(
October 2021
)
|
From India
[
edit
]
The Indian
Mitochondrial DNA
haplogroups, M52'58 and M52a are also present in the Philippines suggesting that there was Indian migration to the archipelago starting from the 5th Century AD.
[20]
The integration of Southeast Asia into Indian Ocean trading networks around 2,000 years ago also shows some impact, with South Asian genetic signals that are present in the
Indonesian archipelago
also extending into the Philippines among the Sama-Bajau communities.
[18]
See also
[
edit
]
References
[
edit
]
- ^
"Genographic Project - Reference Populations ? Geno 2.0 Next Generation"
.
National Geographic
. April 13, 2005. Archived from
the original
on May 22, 2019.
- ^
a
b
Chambers, Geoff (2013). "Genetics and the Origins of the Polynesians".
eLS
. John Wiley & Sons, Inc.
doi
:
10.1002/9780470015902.a0020808.pub2
.
ISBN
978-0470016176
.
- ^
Mijares, Armand Salvador B. (2006).
"The Early Austronesian Migration To Luzon: Perspectives From The Penablanca Cave Sites"
.
Bulletin of the Indo-Pacific Prehistory Association
(26): 72?78. Archived from
the original
on July 7, 2014.
- ^
Bellwood, Peter (2014).
The Global Prehistory of Human Migration
. p. 213.
- ^
a
b
Lipson, Mark; Loh, Po-Ru; Patterson, Nick; Moorjani, Priya; Ko, Ying-Chin; Stoneking, Mark; Berger, Bonnie; Reich, David (2014).
"Reconstructing Austronesian population history in Island Southeast Asia"
(PDF)
.
Nature Communications
.
5
(1): 4689.
Bibcode
:
2014NatCo...5.4689L
.
doi
:
10.1038/ncomms5689
.
PMC
4143916
.
PMID
25137359
.
Archived
(PDF)
from the original on 2014-06-29
. Retrieved
2021-10-20
.
- ^
Martin Richards.
"Climate Change and Postglacial Human Dispersals in Southeast Asia"
. Oxford Journals.
Archived
from the original on October 8, 2012
. Retrieved
April 10,
2014
.
- ^
Rochmyaningsih, Dyna (28 October 2014).
"
'Out of Sundaland' Assumption Disproved"
.
Jakarta Globe
.
Archived
from the original on 25 December 2018
. Retrieved
24 December
2018
.
- ^
Larena, Maximilian; Sanchez-Quinto, Federico; Sjodin, Per; McKenna, James; Ebeo, Carlo; Reyes, Rebecca; Casel, Ophelia; Huang, Jin-Yuan; Hagada, Kim Pullupul; Guilay, Dennis; Reyes, Jennelyn (2021-03-30).
"Multiple migrations to the Philippines during the last 50,000 years"
.
Proceedings of the National Academy of Sciences of the United States of America
.
118
(13): e2026132118.
Bibcode
:
2021PNAS..11826132L
.
doi
:
10.1073/pnas.2026132118
.
ISSN
0027-8424
.
PMC
8020671
.
PMID
33753512
.
- ^
a
b
"With a sample population of 105 Filipinos, the company of
Applied Biosystems
, analysed the Y-DNA of average Filipinos and it is discovered that about 0.95% of the samples have the Y-DNA Haplotype "H1a", which is most common in South Asia and had spread to the Philippines via precolonial Indian missionaries who spread Hinduism and established Indic Rajahnates like Cebu and Butuan. The 13% frequeny of R1b also indicate Spanish admixture"
.
Archived
from the original on 2017-05-25
. Retrieved
2021-10-20
.
- ^
a
b
"Manual Collation"
.
Archived
from the original on 2022-10-26
. Retrieved
2022-10-26
.
- ^
a
b
Philippines DNA Project
Archived
2023-02-04 at the
Wayback Machine
- Y-DNA Classic Chart
- ^
Sheyla Mirabal, Kristian J. Herrera, Tenzin Gayden, Maria Regueiro, Peter A. Underhill, Ralph L. Garcia-Bertrand, and Rene J. Herrera, "Increased Y-chromosome resolution of haplogroup O suggests genetic ties between the Ami aborigines of Taiwan and the Polynesian Islands of Samoa and Tonga."
Gene
492 (2012) 339?348. doi:10.1016/j.gene.2011.10.042
- ^
a
b
c
Trejaut, Jean A; Poloni, Estella S; Yen, Ju-Chen; Lai, Ying-Hui; Loo, Jun-Hun; Lee, Chien-Liang; He, Chun-Lin; Lin, Marie (2014).
"Taiwan Y-chromosomal DNA variation and its relationship with Island Southeast Asia"
.
BMC Genetics
.
15
: 77.
doi
:
10.1186/1471-2156-15-77
.
PMC
4083334
.
PMID
24965575
.
- ^
Karafet, Tatiana M.; Hallmark, Brian; Cox, Murray P.; et al. (2010).
"Major East?West Division Underlies Y Chromosome Stratification across Indonesia"
.
Mol. Biol. Evol
.
27
(8): 1833?1844.
doi
:
10.1093/molbev/msq063
.
PMID
20207712
.
- ^
a
b
Delfin, Frederick; Salvador, Jazelyn M.; Calacal, Gayvelline C.; Perdigon, Henry B.; Tabbada, Kristina A.; Villamor, Lilian P.; Halos, Saturnina C.; Gunnarsdottir, Ellen; Myles, Sean; Hughes, David A.; Xu, Shuhua; Jin, Li; Lao, Oscar; Kayser, Manfred; Hurles, Matthew E.; Stoneking, Mark; De Ungria, Maria Corazon A. (February 2011).
"The Y-chromosome landscape of the Philippines: extensive heterogeneity and varying genetic affinities of Negrito and non-Negrito groups"
.
European Journal of Human Genetics
.
19
(2): 224?230.
doi
:
10.1038/ejhg.2010.162
.
PMC
3025791
.
PMID
20877414
.
- ^
Chang JG, Ko YC, Lee JC, Chang SJ, Liu TC, Shih MC, Peng CT (2002).
"Molecular analysis of mutations and polymorphisms of the Lewis secretor type alpha(1,2)-fucosyltransferase gene reveals that Taiwanese aborigines are of Austronesian derivation"
.
J. Hum. Genet
.
47
(2): 60?5.
doi
:
10.1007/s100380200001
.
PMID
11916003
.
- ^
Yambazi Banda (2015).
"Characterizing Race/Ethnicity and Genetic Ancestry for 100,000 Subjects in the Genetic Epidemiology Research on Adult Health and Aging (GERA) Cohort"
.
Genetics
.
200
(4): 1285?1295.
doi
:
10.1534/genetics.115.178616
.
PMC
4574246
.
PMID
26092716
.
Subsection: (Discussion) "For the non-Hispanic white individuals, we see a broad spectrum of genetic ancestry ranging from northern Europe to southern Europe and the Middle East. Within that large group, with the exception of Ashkenazi Jews, we see little evidence of distinct clusters. This is consistent with considerable exogamy within this group. By comparison, we do see structure in the East Asian population, correlated with nationality, reflecting continuing endogamy for these nationalities and also recent immigration. On the other hand, we did observe a substantial number of individuals who are admixed between East Asian and European ancestry, reflecting ~10% of all those reporting East Asian race/ethnicity. The majority of these reflected individuals with one East Asian and one European parent or one East Asian and three European grandparents. In addition, we noted that for self-reported Filipinos, a substantial proportion have modest levels of European genetic ancestry reflecting older admixture."
- ^
a
b
Larena, Maximilian; Sanchez-Quinto, Federico; Sjodin, Per; McKenna, James; Ebeo, Carlo; Reyes, Rebecca; Casel, Ophelia; Huang, Jin-Yuan; Hagada, Kim Pullupul; Guilay, Dennis; Reyes, Jennelyn (2021-03-30).
"Multiple migrations to the Philippines during the last 50,000 years"
.
Proceedings of the National Academy of Sciences
.
118
(13): e2026132118.
Bibcode
:
2021PNAS..11826132L
.
doi
:
10.1073/pnas.2026132118
.
PMC
8020671
.
PMID
33753512
.
- ^
Kim, Soon-Hee; et al. (2011).
"High frequencies of Y-chromosome haplogroup O2b-SRY465 lineages in Korea: a genetic perspective on the peopling of Korea"
.
Investigative Genetics
.
2
(1): 10.
doi
:
10.1186/2041-2223-2-10
.
PMC
3087676
.
PMID
21463511
.
- ^
Delfin, Frederick; Ko, Albert Min-Shan; Li, Mingkun; Gunnarsdottir, Ellen D.; Tabbada, Kristina A.; Salvador, Jazelyn M.; Calacal, Gayvelline C.; Sagum, Minerva S.; Datar, Francisco A.; Padilla, Sabino G.; De Ungria, Maria Corazon A.; Stoneking, Mark (February 2014).
"Complete mtDNA genomes of Filipino ethnolinguistic groups: a melting pot of recent and ancient lineages in the Asia-Pacific regio"
.
European Journal of Human Genetics
.
22
(2): 228?237.
doi
:
10.1038/ejhg.2013.122
.
PMC
3895641
.
PMID
23756438
.
Indian influence and possibly haplogroups M52'58 and M52a were brought to the Philippines as early as the fifth century AD. However, Indian influence through these trade empires were indirect and mainly commercial; moreover, other Southeast Asian groups served as filters that diluted and/or enriched any Indian influence that reached the Philippines