County in California, United States
County in California, United States
El Dorado County
|
|---|
|
|
|
 Flag
 Seal
|
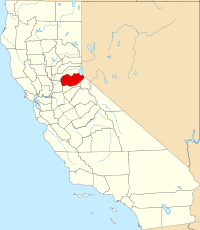
 Interactive map of El Dorado County
|
 |
| Country
| United States
|
|---|
| State
| California
|
|---|
| Regions
| Northern California
,
Sierra Nevada
,
Gold Country
|
|---|
| Metropolitan area
| Greater Sacramento
|
|---|
| Incorporated
| February 18, 1850
[1]
|
|---|
| Named for
| Spanish
for "the golden" and
El Dorado
|
|---|
| County seat
| Placerville
|
|---|
| Largest community
| El Dorado Hills
|
|---|
|
| ? Type
| Council?CAO
|
|---|
| ? Body
|
- John Hidahl
- George Turnboo
- Wendy Thomas
- Lori Parlin
- Brooke Laine
|
|---|
| ? Chair
| Lori Parlin
|
|---|
| ? Vice Chair
| Wendy Thomas
|
|---|
| ? Chief Administrative Office
[3]
| Don Ashton
|
|---|
|
| ? Total
| 1,786 sq mi (4,630 km
2
)
|
|---|
| ? Land
| 1,708 sq mi (4,420 km
2
)
|
|---|
| ? Water
| 78 sq mi (200 km
2
)
|
|---|
| Highest elevation
| 10,886 ft (3,318 m)
|
|---|
|
| ? Total
| 191,185
|
|---|
| ? Density
| 110/sq mi (41/km
2
)
|
|---|
| Time zone
| UTC?8
(
Pacific Time Zone
)
|
|---|
| ? Summer (
DST
)
| UTC?7
(
Pacific Daylight Time
)
|
|---|
| ZIP code
| 95762
|
|---|
| Area code
| 530
,
916, 279
|
|---|
| FIPS
code
| 06-017
|
|---|
| GNIS
feature ID
| 277273
|
|---|
| Congressional districts
| 3rd
,
5th
|
|---|
| Website
| www.edcgov.us
|
|---|
El Dorado County
(
), officially the
County of El Dorado
, is a
county
located in the
U.S. state
of
California
. As of the
2020 census
, the population was 191,185.
[5]
The
county seat
is
Placerville
.
[6]
The county is part of the
Sacramento
-
Roseville
-
Arden-Arcade
, CA
Metropolitan Statistical Area
. It is located entirely in the
Sierra Nevada
, from the historic
Gold Country
in the western foothills to the High Sierra in the east. El Dorado County's population has grown as Greater Sacramento has expanded into the region. Where the county line crosses US 50 at Clarksville, the distance to Sacramento is 15 miles. In the county's high altitude eastern end at
Lake Tahoe
, environmental awareness and environmental protection initiatives have grown along with the population since the
1960 Winter Olympics
, hosted at the former
Squaw Valley Ski Resort
in neighboring
Placer County
.
History
[
edit
]
What is now known as El Dorado County has been home to the
Maidu
,
Nisenan
,
Washoe
, and
Miwok
Indigenous American
nations
for centuries. The region became famous for being the site of the 1848 discovery that sparked the
California Gold Rush
. As a result, the name "El Dorado" was derived from the Spanish word for, "The Gilded One."
[7]
The County of El Dorado was one of California's original 27 counties created effective February 18, 1850 (the number has risen to 58 today). Its name is derived from the Spanish meaning "the gilded/golden".
[8]
The final segments of the
Pony Express
mail route ran through El Dorado County until its replacement with the telegraph service in 1861;
U.S. Highway 50
follows the Pony Express route today.
- Local landmarks:
The
Placerville Mountain Democrat
, California's oldest surviving newspaper, serves El Dorado County.
The
Caldor Fire
started on August 14, 2021, near Little Mountain, south of
Pollock Pines
in El Dorado County,
[9]
about two miles East of
Omo Ranch
and four miles south of
Grizzly Flats
.
[10]
[11]
It initially burned slowly, but exploded in size on August 16 due to high winds. By the night of August 16 it was 6,500 acres (2,600 ha).
[12]
On August 17 the fire grew to 30,000 acres (12,000 ha) as it expanded rapidly north and east, crossing the North Fork Cosumnes River and approaching
Sly Park Reservoir
. By August 20 the fire had burned nearly to
Highway 50
, forcing a closure of the highway.
[13]
Over the next few days, the fire crossed Highway 50 in the vicinity of
Kyburz
. Starting on August 27 winds drove the fire rapidly east towards the
Lake Tahoe
Basin. By August 30, it had reached
Echo Summit
, less than 5 miles (8.0 km) from
South Lake Tahoe
.
There are only two municipalities in El Dorado County:
Placerville
and
South Lake Tahoe
.
[14]
Government and policing
[
edit
]
Policing
[
edit
]
The El Dorado County Sheriff provides court protection, county jail administration, and coroner service for all of the county and provides patrol and detective services for the unincorporated areas of the county. Incorporated cities Placerville, population 11,000, has a municipal police department, as does South Lake Tahoe, population 22,000.
Sheriffs
[
edit
]
- James Hume (Feb 18, 1850- November 7, 1852)
- Steven Charles Austin (Nov 7, 1852- November 7, 1856)
- William Tanner Henson (Nov 7, 1856- September 15, 1859) - Resigned
- Walter J. Burwell (Sep 15, 1859- August 15, 1863) - Resigned
- Henry Gooding (Aug 15, 1863- November 7, 1867)
- Jacob Hart Neff (Nov 7, 1867- November 7, 1871)
- Charles Benjamin Dunnam (Nov 7, 1871- November 7, 1875)
- Jason McCormick (Nov 7, 1875- November 7, 1881)
- George Burnham (Nov 7, 1881- November 7, 1883)
- Thomas Augustus Galt (Nov 7, 1883- November 7, 1887)
- George H. Hilbert (Nov 7, 1887- November 7, 1898)
- Archie Speer Bosquit (Nov 7, 1898- November 7, 1907)
- Gilbert Cook (Nov 7, 1907- May 9, 1912) - Suicide
- Albert George Bradshaw (May 9, 1912- November 7, 1914)
- Charles E. Hand (Nov 7, 1914- November 7, 1925)
- Charles F. Woods (Nov 7, 1925- November 7, 1931)
- George Martin Smith Sr. (Nov 7, 1931- November 7, 1941)
- Lowell Fred West (Nov 7, 1941- November 7, 1949)
- Rowland Lee Morris (Nov 7, 1949- November 7, 1955)
- Ernie Carlson (Nov 7, 1955- November 7, 1965)
- Robert Mitchum (Nov 7, 1965- November 7, 1971)
- Ernie Carlson (Nov 7, 1971- November 7, 1975)
- Al Coombs (Nov 7, 1975 - November 7, 1977)
- Richard "Dick" Pacileo (Nov 7, 1975 - November 7, 1991)
- Don McDonald (1991 - 1997)
- Hal Barker (1997 - 2002)
- Jeff Neves (Nov 7, 2001- November 7, 2010)
- John D'Agostini (Nov 7, 2010 - January 3, 2023)
- Jeff Leikauf (current, from January 3, 2023)
Geography
[
edit
]
According to the
U.S. Census Bureau
, the county has a total area of 1,786 square miles (4,630 km
2
), of which 1,708 square miles (4,420 km
2
) is land and 78 square miles (200 km
2
) (4.4%) is water.
[15]
The county, owing to its location in the Sierra Nevada, consists of rolling hills and mountainous terrain. The northeast corner is in the Lake Tahoe Basin (part of the
Great Basin
), including a portion of the lake itself. Across the Sierra crest to the west lies the majority of the county, referred to as the "western slope." A portion of
Folsom Lake
is in the northwest corner of the county.
Much of the county is public land. The
Eldorado National Forest
comprises a significant portion (approximately 43%) of the county's land area, primarily on the western slope. The
Lake Tahoe Basin Management Unit
, formerly part of the Eldorado and two other National Forests, manages much of the land east of the crest. The
Pacific Crest Trail
runs through the eastern part of the county, along or roughly paralleling the Sierra crest. The county is home to the
Desolation Wilderness
, a popular destination for hiking, backpacking, and fishing.
Adjacent counties
[
edit
]
Geographic features
[
edit
]
Recreation
[
edit
]
Parks
[
edit
]
Skiing
[
edit
]
Racing
[
edit
]
Wineries
[
edit
]
Demographics
[
edit
]
The vast majority of the population lives in a narrow strip along
U.S. Route 50
, with the majority living between El Dorado Hills and Pollock Pines. The remainder resides in the South Lake Tahoe area, and in various dispersed rural communities.
Historical population
| Census
| Pop.
| Note
| %±
|
|---|
| 1850
| 20,057
| | ?
|
|---|
| 1860
| 20,562
| | 2.5%
|
|---|
| 1870
| 10,309
| | ?49.9%
|
|---|
| 1880
| 10,683
| | 3.6%
|
|---|
| 1890
| 9,232
| | ?13.6%
|
|---|
| 1900
| 8,986
| | ?2.7%
|
|---|
| 1910
| 7,492
| | ?16.6%
|
|---|
| 1920
| 6,426
| | ?14.2%
|
|---|
| 1930
| 8,325
| | 29.6%
|
|---|
| 1940
| 13,229
| | 58.9%
|
|---|
| 1950
| 16,207
| | 22.5%
|
|---|
| 1960
| 29,390
| | 81.3%
|
|---|
| 1970
| 43,833
| | 49.1%
|
|---|
| 1980
| 85,812
| | 95.8%
|
|---|
| 1990
| 125,955
| | 46.8%
|
|---|
| 2000
| 156,299
| | 24.1%
|
|---|
| 2010
| 181,058
| | 15.8%
|
|---|
| 2020
| 191,185
| | 5.6%
|
|---|
| 2023 (est.)
| 192,215
| [17]
| 0.5%
|
|---|
|
2020 census
[
edit
]
El Dorado County, California - Demographic Profile
(
NH = Non-Hispanic
)
| Race / Ethnicity
|
Pop 2010
[22]
|
Pop 2020
[23]
|
% 2010
|
% 2020
|
| White
alone (NH)
|
144,689
|
140,141
|
79.91%
|
73.30%
|
| Black or African American
alone (NH)
|
1,296
|
1,436
|
0.72%
|
0.75%
|
| Native American
or
Alaska Native
alone (NH)
|
1,553
|
1,273
|
0.86%
|
0.67%
|
| Asian
alone (NH)
|
6,143
|
9,024
|
3.39%
|
4.72%
|
| Pacific Islander
alone (NH)
|
261
|
276
|
0.14%
|
0.14%
|
| Some Other Race
alone (NH)
|
318
|
1,215
|
0.18%
|
0.64%
|
| Mixed Race/Multi-Racial
(NH)
|
4,923
|
11,361
|
2.72%
|
5.94%
|
| Hispanic or Latino
(any race)
|
21,875
|
26,459
|
12.08%
|
13.84%
|
| Total
|
181,058
|
191,185
|
100.00%
|
100.00%
|
Note: the US Census treats Hispanic/Latino as an ethnic category. This table excludes Latinos from the racial categories and assigns them to a separate category. Hispanics/Latinos can be of any race.
2011
[
edit
]
| Population, race, and income
|
| Total population
[24]
|
179,878
|
| White
[24]
|
157,853
|
87.8%
|
| Black or African American
[24]
|
1,367
|
0.8%
|
| American Indian or Alaska Native
[24]
|
1,802
|
1.0%
|
| Asian
[24]
|
6,260
|
3.5%
|
| Native Hawaiian or other Pacific Islander
[24]
|
167
|
0.1%
|
| Some other race
[24]
|
6,323
|
3.5%
|
| Two or more races
[24]
|
6,106
|
3.4%
|
| Hispanic or Latino (of any race)
[25]
|
21,222
|
11.8%
|
| Per capita income
[26]
|
$34,385
|
| Median household income
[27]
|
$68,815
|
| Median family income
[28]
|
$82,930
|
Places by population, race, and income
[
edit
]
| Places by population and race
|
| Place
|
Type
[29]
|
Population
[24]
|
White
[24]
|
Other
[24]
[note 1]
|
Asian
[24]
|
Black or African
American
[24]
|
Native American
[24]
[note 2]
|
Hispanic or Latino
(of any race)
[25]
|
| Auburn Lake Trails
|
CDP
|
3,741
|
97.0%
|
1.5%
|
0.2%
|
1.0%
|
0.3%
|
2.3%
|
| Cameron Park
|
CDP
|
16,697
|
90.8%
|
6.1%
|
2.2%
|
0.6%
|
0.4%
|
15.4%
|
| Camino
|
CDP
|
1,933
|
98.7%
|
0.7%
|
0.3%
|
0.4%
|
0.0%
|
3.5%
|
| Cold Springs
|
CDP
|
569
|
90.9%
|
9.1%
|
0.0%
|
0.0%
|
0.0%
|
3.3%
|
| Coloma
|
CDP
|
353
|
82.4%
|
17.3%
|
0.3%
|
0.0%
|
0.0%
|
20.1%
|
| Diamond Springs
|
CDP
|
11,367
|
93.6%
|
2.3%
|
1.3%
|
0.7%
|
2.1%
|
9.4%
|
| El Dorado Hills
|
CDP
|
43,563
|
84.0%
|
5.4%
|
8.9%
|
1.7%
|
0.1%
|
7.3%
|
| Georgetown
|
CDP
|
2,338
|
89.9%
|
8.2%
|
0.0%
|
0.1%
|
1.8%
|
10.7%
|
| Grizzly Flats
|
CDP
|
923
|
97.4%
|
0.0%
|
0.9%
|
0.0%
|
1.7%
|
6.7%
|
| Placerville
|
City
|
10,394
|
82.5%
|
12.0%
|
2.0%
|
0.7%
|
2.9%
|
19.4%
|
| Pollock Pines
|
CDP
|
6,953
|
95.2%
|
3.6%
|
0.8%
|
0.0%
|
0.4%
|
9.8%
|
| Shingle Springs
|
CDP
|
4,797
|
92.7%
|
2.0%
|
0.0%
|
0.7%
|
4.6%
|
16.7%
|
| South Lake Tahoe
|
City
|
21,814
|
76.8%
|
16.8%
|
4.5%
|
0.6%
|
1.3%
|
31.3%
|
| Tahoma
‡
|
CDP
|
563
|
82.8%
|
17.2%
|
0.0%
|
0.0%
|
0.0%
|
8.5%
|
| ‡ Data for El Dorado County area of this CDP
|
| Places by population and income
|
| Place
|
Type
[29]
|
Population
[30]
|
Per capita income
[26]
|
Median household income
[27]
|
Median family income
[28]
|
| Auburn Lake Trails
|
CDP
|
3,741
|
$35,522
|
$79,573
|
$92,308
|
| Cameron Park
|
CDP
|
16,697
|
$34,839
|
$72,562
|
$84,361
|
| Camino
|
CDP
|
1,933
|
$26,015
|
$51,742
|
$63,412
|
| Cold Springs (El Dorado County)
|
CDP
|
569
|
$30,925
|
$97,576
|
$99,286
|
| Coloma
|
CDP
|
353
|
$22,462
|
$44,844
|
$44,844
|
| Diamond Springs
|
CDP
|
11,367
|
$28,786
|
$52,911
|
$62,150
|
| El Dorado Hills
|
CDP
|
43,563
|
$44,920
|
$115,121
|
$123,816
|
| Georgetown
|
CDP
|
2,338
|
$24,117
|
$52,169
|
$62,614
|
| Grizzly Flats
|
CDP
|
923
|
$20,902
|
$32,365
|
$56,813
|
| Placerville
|
City
|
10,394
|
$26,109
|
$53,385
|
$66,890
|
| Pollock Pines
|
CDP
|
6,953
|
$30,826
|
$54,478
|
$62,760
|
| Shingle Springs
|
CDP
|
4,797
|
$34,055
|
$86,786
|
$89,778
|
| South Lake Tahoe
|
City
|
21,814
|
$22,958
|
$41,685
|
$51,538
|
| Tahoma
‡
|
CDP
|
563
|
$32,105
|
$54,286
|
$63,646
|
| ‡ Data for El Dorado County area of this CDP
|
2010 Census
[
edit
]
The
2010 United States Census
reported that El Dorado County had a population of 181,058. The racial makeup of El Dorado County was 156,793 (86.6%)
White
, 1,409 (0.8%)
African American
, 2,070 (1.1%)
Native American
, 6,297 (3.5%)
Asian
, 294 (0.2%)
Pacific Islander
, 7,278 (4.0%) from
other races
, and 6,917 (3.8%) from two or more races.
Hispanic
or
Latino
of any race were 21,875 persons (12.1%).
[31]
The largest growth in the county has come in El Dorado Hills where the population grew by 24,092 residents to a total of 42,108 since 2000.
[31]
| Population reported at
2010 United States Census
|
The County
|
Total
Population
|
|
|
|
|
|
|
two or
more races
|
|
| El Dorado County
|
181,058
|
156,793
|
1,409
|
2,070
|
6,297
|
294
|
7,278
|
6,917
|
21,875
|
|
Total
Population
|
|
|
|
|
|
|
two or
more races
|
|
| Placerville
|
10,389
|
8,716
|
80
|
162
|
98
|
13
|
867
|
453
|
1,863
|
| South Lake Tahoe
|
21,403
|
15,733
|
182
|
232
|
1,186
|
39
|
3,230
|
801
|
6,665
|
|
Total
Population
|
|
|
|
|
|
|
two or
more races
|
|
| Auburn Lake Trails
|
3,426
|
3,190
|
6
|
28
|
36
|
5
|
45
|
116
|
208
|
| Cameron Park
|
18,228
|
16,242
|
143
|
194
|
425
|
36
|
461
|
727
|
2,056
|
| Camino
|
1,750
|
1,604
|
7
|
14
|
18
|
4
|
55
|
48
|
197
|
| Cold Springs
|
446
|
413
|
4
|
5
|
3
|
0
|
15
|
6
|
43
|
| Coloma
|
529
|
462
|
4
|
3
|
8
|
0
|
15
|
37
|
63
|
| Diamond Springs
|
11,037
|
9,743
|
39
|
176
|
110
|
6
|
518
|
445
|
1,377
|
| El Dorado Hills
|
42,108
|
35,089
|
615
|
196
|
3,563
|
71
|
681
|
1,893
|
3,802
|
| Georgetown
|
2,367
|
2,128
|
47
|
59
|
18
|
2
|
45
|
68
|
177
|
| Grizzly Flats
|
1,066
|
954
|
6
|
14
|
7
|
2
|
19
|
64
|
96
|
| Pollock Pines
|
6,871
|
6,195
|
18
|
128
|
56
|
3
|
251
|
220
|
713
|
| Shingle Springs
|
4,432
|
3,919
|
14
|
108
|
50
|
3
|
132
|
206
|
469
|
| Tahoma
‡
|
780
|
736
|
2
|
7
|
7
|
0
|
11
|
17
|
35
|
|
Total
Population
|
|
|
|
|
|
|
two or
more races
|
|
| All others not CDPs (combined)
|
56,226
|
51,669
|
242
|
744
|
712
|
110
|
933
|
1,816
|
4,111
|
| ‡ Note: these numbers reflect only the portion of this CDP in El Dorado County
|
2000
[
edit
]
As of the
census
[32]
of 2000, there were 156,299 people, 58,939 households, and 43,025 families residing in the county. The population density was 91 inhabitants per square mile (35/km
2
). There were 71,278 housing units at an average density of 42 per square mile (16/km
2
). The racial makeup of the county was 89.7%
White
, 0.5%
Black
or
African American
, 1.0%
Native American
, 2.1%
Asian
, 0.1%
Pacific Islander
, 3.6% from
other races
, and 3.0% from two or more races. 9.3% of the population were
Hispanic
or
Latino
of any race. 14.9% were of
German
, 13.4%
English
, 10.3%
Irish
, 6.6%
Italian
and 6.6%
American ancestry
according to
Census 2000
. 90.5% spoke
English
and 6.5%
Spanish
as their first language.
There were 58,939 households, out of which 34.2% had youngsters under the age of 18 living with them, 60.1% were
married couples
living together, 8.9% had a female householder with no husband present, and 27.0% were non-families. 20.1% of all households were made up of individuals, and 7.3% had someone living alone who was 65 years of age or older. The average household size was 2.63 and the average family size was 3.04.
In the county, the population was spread out, with 26.1% under the age of 18, 6.8% from 18 to 24, 27.8% from 25 to 44, 26.9% from 45 to 64, and 12.4% who were 65 years of age or older. The median age was 39 years. For every 100 females, there were 99.5 males. For every 100 females age 18 and over, there were 97.3 males.
The 2000 census also states that the median income for a household in the county was $51,484, and the median income for a family was $60,250. Males had a median income of $46,373 versus $31,537 for females. The
per capita income
for the county was $25,560. About 5.0% of families and 7.1% of the population were below the
poverty line
, including 7.6% of those under age 18 and 5.0% of those age 65 or over.
Politics
[
edit
]
Voter registration statistics
[
edit
]
| Population and registered voters
|
| Total population
[24]
|
179,878
|
| Registered voters
[33]
[note 3]
|
110,206
|
61.3%
|
| Democratic
[33]
|
32,176
|
29.2%
|
| Republican
[33]
|
48,362
|
43.9%
|
| Democratic?Republican spread
[33]
|
-16,186
|
-14.7%
|
| American Independent
[33]
|
4,214
|
3.8%
|
| Green
[33]
|
887
|
0.8%
|
| Libertarian
[33]
|
1,010
|
0.9%
|
| Peace and Freedom
[33]
|
293
|
0.3%
|
| Americans Elect
[33]
|
5
|
0.0%
|
| Other
[33]
|
883
|
0.8%
|
| No party preference
[33]
|
22,376
|
20.3%
|
Cities by population and voter registration
[
edit
]
Overview
[
edit
]
El Dorado is a predominantly
Republican
county in
presidential
and
congressional
elections. However, from 1880 until 1952, the county was a Democratic stronghold, with
Theodore Roosevelt
and
Warren Harding
being the only two Republicans to carry the county. Since 1952, however, El Dorado has gone Democratic only three times: in 1960 narrowly for
John F. Kennedy
, in 1964 in a landslide for
Lyndon Johnson
, and in 1976 narrowly for
Jimmy Carter
.
United States presidential election results for El Dorado County, California
[34]
| Year
|
Republican
|
Democratic
|
Third party
|
| No.
|
%
|
No.
|
%
|
No.
|
%
|
| 2020
|
61,838
|
53.24%
|
51,621
|
44.44%
|
2,700
|
2.32%
|
| 2016
|
49,247
|
51.76%
|
36,404
|
38.26%
|
9,498
|
9.98%
|
| 2012
|
50,973
|
57.27%
|
35,166
|
39.51%
|
2,859
|
3.21%
|
| 2008
|
50,314
|
53.92%
|
40,529
|
43.44%
|
2,466
|
2.64%
|
| 2004
|
52,878
|
61.23%
|
32,242
|
37.33%
|
1,244
|
1.44%
|
| 2000
|
42,045
|
58.29%
|
26,220
|
36.35%
|
3,871
|
5.37%
|
| 1996
|
32,759
|
51.84%
|
22,957
|
36.33%
|
7,480
|
11.84%
|
| 1992
|
25,906
|
39.92%
|
21,012
|
32.38%
|
17,969
|
27.69%
|
| 1988
|
30,021
|
59.33%
|
19,801
|
39.13%
|
781
|
1.54%
|
| 1984
|
27,583
|
64.93%
|
14,312
|
33.69%
|
583
|
1.37%
|
| 1980
|
21,238
|
58.27%
|
10,765
|
29.53%
|
4,446
|
12.20%
|
| 1976
|
12,472
|
47.69%
|
12,763
|
48.80%
|
919
|
3.51%
|
| 1972
|
11,330
|
54.20%
|
8,654
|
41.40%
|
921
|
4.41%
|
| 1968
|
7,468
|
49.00%
|
6,054
|
39.72%
|
1,719
|
11.28%
|
| 1964
|
5,775
|
39.53%
|
8,810
|
60.30%
|
25
|
0.17%
|
| 1960
|
6,065
|
49.16%
|
6,175
|
50.05%
|
97
|
0.79%
|
| 1956
|
4,613
|
53.60%
|
3,957
|
45.97%
|
37
|
0.43%
|
| 1952
|
5,203
|
60.51%
|
3,297
|
38.35%
|
98
|
1.14%
|
| 1948
|
2,894
|
43.04%
|
3,493
|
51.95%
|
337
|
5.01%
|
| 1944
|
1,990
|
39.55%
|
3,016
|
59.95%
|
25
|
0.50%
|
| 1940
|
2,019
|
32.37%
|
4,144
|
66.44%
|
74
|
1.19%
|
| 1936
|
1,228
|
23.12%
|
4,019
|
75.66%
|
65
|
1.22%
|
| 1932
|
956
|
23.12%
|
3,034
|
73.37%
|
145
|
3.51%
|
| 1928
|
1,228
|
44.25%
|
1,516
|
54.63%
|
31
|
1.12%
|
| 1924
|
852
|
28.49%
|
361
|
12.07%
|
1,778
|
59.45%
|
| 1920
|
1,636
|
64.36%
|
726
|
28.56%
|
180
|
7.08%
|
| 1916
|
1,068
|
35.10%
|
1,755
|
57.67%
|
220
|
7.23%
|
| 1912
|
16
|
0.59%
|
1,613
|
59.04%
|
1,103
|
40.37%
|
| 1908
|
986
|
44.74%
|
1,019
|
46.23%
|
199
|
9.03%
|
| 1904
|
1,248
|
54.10%
|
865
|
37.49%
|
194
|
8.41%
|
| 1900
|
1,193
|
45.14%
|
1,406
|
53.20%
|
44
|
1.66%
|
| 1896
|
1,130
|
39.54%
|
1,674
|
58.57%
|
54
|
1.89%
|
| 1892
|
1,159
|
43.80%
|
1,270
|
48.00%
|
217
|
8.20%
|
| 1888
|
1,350
|
47.02%
|
1,456
|
50.71%
|
65
|
2.26%
|
| 1884
|
1,289
|
45.47%
|
1,469
|
51.82%
|
77
|
2.72%
|
| 1880
|
1,419
|
47.89%
|
1,520
|
51.30%
|
24
|
0.81%
|
The county is noted as a center of political concern with the United Nations non-binding sustainable development plan
Agenda 21
, which was on the County Board of Supervisors meeting Agenda on May 15, 2012. Concerns included the threat of U.S. Forest Service road closures and traffic roundabouts.
[35]
On February 19, 2013, 14 members of the El Dorado County Grand Jury resigned, forcing Supervising Judge Steven Bailey to dissolve it.
[36]
El Dorado County has a secessionist movement, calling for the county of less than 200,000 residents to become a new state of the union.
Wyoming
, the least populous current state, has approximately three times the number of residents. Sharon Durst, one of the leaders of the movement, was previously a supporter of the
State of Jefferson
movement, that advocates for Northern California counties and Southern Oregon counties to form a new state. El Dorado County's seat,
Placerville, California
, is located 45 miles from
Sacramento
, the state's capital. The leadership of the movement acknowledges that it is unlikely that the California legislature would approve their separation from the state, as required by the
United States Constitution
. They promote an unproven theory that the county "is technically not a legitimate piece of California and is instead 'other property' of Congress".
[37]
El Dorado County is split between two Congressional districts, with the western third of the County in the
5th Congressional District
, represented by
Tom McClintock
, and the eastern two-thirds in the
3rd Congressional District
, represented by
Kevin Kiley
. In the
State Assembly
, the county is split between
the 5th Assembly District
, represented by
Republican
Joe Patterson
and
the 6th Assembly District
, represented by
Democrat
Kevin McCarty
.
[38]
In the
State Senate
, it is in
the 1st Senate District
, represented by
Republican
Brian Dahle
.
[39]
Crime
[
edit
]
The following table includes the number of incidents reported and the rate per 1,000 persons for each type of offense.
| Population and crime rates
|
| Population
[24]
|
179,878
|
| Violent crime
[40]
|
520
|
2.89
|
| Homicide
[40]
|
3
|
0.02
|
| Forcible rape
[40]
|
50
|
0.28
|
| Robbery
[40]
|
71
|
0.39
|
| Aggravated assault
[40]
|
396
|
2.20
|
| Property crime
[40]
|
1,736
|
9.65
|
| Burglary
[40]
|
932
|
5.18
|
| Larceny-theft
[40]
[41]
|
1,540
|
8.56
|
| Motor vehicle theft
[40]
|
178
|
0.99
|
| Arson
[40]
|
17
|
0.09
|
Cities by population and crime rates
[
edit
]
Cities by population and crime rates
| City
|
Population
[42]
|
Violent crimes
[42]
|
Violent crime rate
per 1,000 persons
|
Property crimes
[42]
|
Property crime rate
per 1,000 persons
|
| Placerville
|
10,479
|
55
|
5.25
|
194
|
18.51
|
| South Lake Tahoe
|
21,586
|
148
|
6.86
|
544
|
25.20
|
Transportation
[
edit
]
Major highways
[
edit
]
 Map of El Dorado County in Northern California
Public transportation
[
edit
]
- El Dorado Transit
[43]
runs local service in Placerville and surrounding areas (as far east as Pollock Pines). Commuter service into Sacramento and Folsom is also provided.
- Tahoe Transportation District
Tahoe Transportation District
is the transit operator for the South Lake Tahoe area. Service also runs into the state of
Nevada
.
Airports
[
edit
]
General aviation airports include
Placerville Airport
,
Georgetown Airport
,
Cameron Park airport
and
Lake Tahoe Airport
.
Asbestos
[
edit
]
Portions of El Dorado County are known to contain natural
asbestos
formations near the surface.
[44]
The
USGS
studied
amphiboles
in rock and soil in the area in response to an EPA sampling study and subsequent criticism of the EPA study. The study found that many amphibole particles in the area meet the counting rule criteria used by the EPA for chemical and morphological limits, but do not meet morphological requirements for commercial-grade-asbestos. The executive summary pointed out that even particles that do not meet requirements for commercial-grade-asbestos may be a health threat and suggested a collaborative research effort to assess health risks associated with naturally occurring asbestos.
[45]
In 2003 after construction of the Oak Ridge High School (El Dorado Hills) soccer field, the federal
Agency for Toxic Substances and Disease Registry
found that some student athletes, coaches and school workers had received substantial exposures. The inside of the school needed to be cleaned of dust.
[44]
Sister relationships
[
edit
]
[46]
Communities
[
edit
]
 El Dorado County Courthouse in Placerville
Cities
[
edit
]
Census-designated places
[
edit
]
Other unincorporated communities
[
edit
]
Population ranking
[
edit
]
The population ranking of the following table is based on the
2020 census
of El Dorado County.
[47]
†
county seat
| Rank
|
City/town/etc.
|
Municipal type
|
Population (2020 Census)
|
| 1
|
El Dorado Hills
|
CDP
|
50,547
|
| 2
|
South Lake Tahoe
|
City
|
21,330
|
| 3
|
Cameron Park
|
CDP
|
18,881
|
| 4
|
Diamond Springs
|
CDP
|
11,345
|
| 5
|
†
Placerville
|
City
|
10,747
|
| 6
|
Pollock Pines
|
CDP
|
7,112
|
| 7
|
Shingle Springs
|
CDP
|
4,660
|
| 8
|
Auburn Lake Trails
|
CDP
|
3,388
|
| 9
|
Georgetown
|
CDP
|
2,255
|
| 10
|
Camino
|
CDP
|
1,871
|
| 11
|
Grizzly Flats
|
CDP
|
1,093
|
| 12
|
Tahoma
(
partially in
Placer County
)
|
CDP
|
1,034
|
| 13
|
Cold Springs
|
CDP
|
556
|
| 14
|
Coloma
|
CDP
|
521
|
| 15
|
Shingle Springs Rancheria
[48]
|
AIAN
|
108
|
See also
[
edit
]
Notes
[
edit
]
- ^
Other = Some other race + Two or more races
- ^
Native American = Native Hawaiian or other Pacific Islander + American Indian or Alaska Native
- ^
a
b
Percentage of registered voters with respect to total population. Percentages of party members with respect to registered voters follow.
References
[
edit
]
- ^
"Chronology"
. California State Association of Counties. Archived from
the original
on January 29, 2016
. Retrieved
February 6,
2015
.
- ^
"Board of Supervisors - El Dorado County"
.
- ^
"Chief Administrative Office - El Dorado County"
.
- ^
"Freel Peak"
. Peakbagger.com
. Retrieved
February 6,
2015
.
- ^
"El Dorado County, California"
.
United States Census Bureau
. Retrieved
January 30,
2022
.
- ^
"Find a County"
. National Association of Counties. Archived from
the original
on July 12, 2012
. Retrieved
June 7,
2011
.
- ^
"Brief History of El Dorado County"
.
El Dorado County GenWeb
. August 1, 2008.
Archived
from the original on April 1, 2013
. Retrieved
March 23,
2016
.
- ^
Gannett, Henry (1905).
The Origin of Certain Place Names in the United States
. Govt. Printing Office. p.
116
.
- ^
"Caldor Fire Incident Update"
.
Cal Fire
. State of California. August 16, 2021
. Retrieved
September 1,
2021
.
Situation Summary: The Caldor Fire started August 14, 2021 near Little Mountain, south of Pollock Pines in El Dorado County.
- ^
"CALDOR FIRE: 219,000+ acres, 68 percent contained"
.
- ^
"How did the Caldor Fire in California start?"
.
AS.com
. August 23, 2021
. Retrieved
September 23,
2021
.
- ^
Stanton, Sam; McGough, Michael; Kasler, Dale; Ahumada, Rosalio (August 18, 2021).
"Caldor Fire levels homes in Grizzly Flats, destroys school, church in El Dorado County"
.
The Modesto Bee
. Retrieved
September 6,
2021
.
- ^
"Caldor Fire Containment Remains at 71%"
. September 19, 2021
. Retrieved
September 23,
2021
.
- ^
"About Us"
.
www.edcgov.us
.
- ^
"2010 Census Gazetteer Files"
. United States Census Bureau. August 22, 2012
. Retrieved
September 24,
2015
.
- ^
"Freel Peak : Climbing, Hiking & Mountaineering : SummitPost"
.
www.summitpost.org
. Retrieved
March 15,
2018
.
- ^
"Annual Estimates of the Resident Population for Counties: April 1, 2020 to July 1, 2023"
. United States Census Bureau
. Retrieved
March 26,
2024
.
- ^
"Census of Population and Housing from 1790-2000"
.
US Census Bureau
. Retrieved
January 24,
2022
.
- ^
"Historical Census Browser"
. University of Virginia Library
. Retrieved
September 24,
2015
.
- ^
Forstall, Richard L., ed. (March 27, 1995).
"Population of Counties by Decennial Census: 1900 to 1990"
. United States Census Bureau
. Retrieved
September 24,
2015
.
- ^
"Census 2000 PHC-T-4. Ranking Tables for Counties: 1990 and 2000"
(PDF)
. United States Census Bureau. April 2, 2001
. Retrieved
September 24,
2015
.
- ^
a
b
"P2 HISPANIC OR LATINO, AND NOT HISPANIC OR LATINO BY RACE - 2010: DEC Redistricting Data (PL 94-171) - El Dorado County, California"
.
United States Census Bureau
.
- ^
a
b
"P2 HISPANIC OR LATINO, AND NOT HISPANIC OR LATINO BY RACE - 2020: DEC Redistricting Data (PL 94-171) - El Dorado County, California"
.
United States Census Bureau
.
- ^
a
b
c
d
e
f
g
h
i
j
k
l
m
n
o
p
q
U.S. Census Bureau. American Community Survey, 2011 American Community Survey 5-Year Estimates, Table B02001.
U.S. Census website
. Retrieved October 26, 2013.
- ^
a
b
U.S. Census Bureau. American Community Survey, 2011 American Community Survey 5-Year Estimates, Table B03003.
U.S. Census website
. Retrieved October 26, 2013.
- ^
a
b
U.S. Census Bureau. American Community Survey, 2011 American Community Survey 5-Year Estimates, Table B19301.
U.S. Census website
. Retrieved October 21, 2013.
- ^
a
b
U.S. Census Bureau. American Community Survey, 2011 American Community Survey 5-Year Estimates, Table B19013.
U.S. Census website
. Retrieved October 21, 2013.
- ^
a
b
U.S. Census Bureau. American Community Survey, 2011 American Community Survey 5-Year Estimates, Table B19113.
U.S. Census website
. Retrieved October 21, 2013.
- ^
a
b
U.S. Census Bureau. American Community Survey, 2011 American Community Survey 5-Year Estimates.
U.S. Census website
. Retrieved October 21, 2013.
- ^
U.S. Census Bureau. American Community Survey, 2011 American Community Survey 5-Year Estimates, Table B01003.
U.S. Census website
. Retrieved October 21, 2013.
- ^
a
b
"2010 Census P.L. 94-171 Summary File Data"
.
United States Census Bureau
.
- ^
"U.S. Census website"
.
United States Census Bureau
. Retrieved
May 14,
2011
.
- ^
a
b
c
d
e
f
g
h
i
j
k
l
m
n
o
p
q
California Secretary of State.
February 10, 2013 - Report of Registration
Archived
November 3, 2013, at the
Wayback Machine
. Retrieved October 31, 2013.
- ^
Leip, David.
"Dave Leip's Atlas of U.S. Presidential Elections"
.
uselectionatlas.org
. Retrieved
March 15,
2018
.
- ^
Carlos Alcala (May 24, 2012).
"El Dorado County folks riled by U.N. agenda for sustainable growth"
.
Sacramento Bee
. Archived from
the original
on April 11, 2013
. Retrieved
March 10,
2013
.
- ^
Cathy Locke (March 10, 2013).
"The Public Eye: El Dorado County grand jury disbands after mass resignation"
.
Sacramento Bee
. Archived from
the original
on March 12, 2013
. Retrieved
March 10,
2013
.
- ^
Ting, Eric (July 17, 2023).
"
'This state is under tyranny': Scenes from California's latest secession movement"
.
SFGate
.
San Francisco
. Retrieved
July 17,
2023
.
- ^
"Members Assembly"
. State of California
. Retrieved
April 5,
2013
.
- ^
"Senators"
. State of California
. Retrieved
April 5,
2013
.
- ^
a
b
c
d
e
f
g
h
i
j
Office of the Attorney General, Department of Justice, State of California.
Table 11: Crimes ? 2009
Archived
December 2, 2013, at the
Wayback Machine
. Retrieved November 14, 2013.
- ^
Only larceny-theft cases involving property over $400 in value are reported as property crimes.
- ^
a
b
c
United States Department of Justice, Federal Bureau of Investigation.
Crime in the United States, 2012, Table 8 (California)
. Retrieved November 14, 2013.
- ^
"El Dorado Transit - El Dorado Transit: Public Transportation for El Dorado County, California"
.
www.eldoradotransit.com
. Retrieved
March 15,
2018
.
- ^
a
b
Raloff, Janet (July 8, 2006),
"Dirty Little Secret"
,
Science News
, archived from
the original
on July 13, 2007
- ^
- ^
"Northern and Central California Sister Cities in Japan"
.
- ^
"2020 U.S. Census website"
.
United States Census Bureau
. Retrieved
April 16,
2024
.
- ^
Staff, Website Services & Coordination.
"US Census Bureau 2010 Census Interactive Population Map"
.
www.census.gov
. Retrieved
March 15,
2018
.
[
permanent dead link
]
External links
[
edit
]
Places adjacent to El Dorado County, California
|
|---|
|
|
|---|
| Counties
| |
|---|
| Major city
| |
|---|
Cities
and
towns
| | 100k?200k
| |
|---|
| 25k?100k
| |
|---|
| 10k?25k
| |
|---|
|
|---|
| Sub-regions
| |
|---|
38°47′N
120°32′W
/
38.78°N 120.53°W
/
38.78; -120.53
|
|---|
| International
| |
|---|
| National
| |
|---|
| Other
| |
|---|