| Demographics of
Solomon Islands
|
|---|
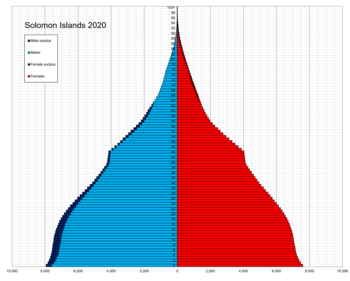 Population pyramid of the Solomon Islands in 2020
|
| Population
| 702,694 (2022 est.)
|
|---|
| Growth rate
| 1.72% (2022 est.)
|
|---|
| Birth rate
| 22.71 births/1,000 population (2022 est.)
|
|---|
| Death rate
| 3.96 deaths/1,000 population (2022 est.)
|
|---|
| Net migration rate
| -1.55 migrant(s)/1,000 population (2022 est.)
|
|---|
|
| 0?14 years
| 32.99%
|
|---|
| 65 and over
| 4.51%
|
|---|
|
| Nationality
| Solomon Islander
|
|---|
| Major ethnic
| Melanesian (95.3%)
|
|---|
 Population
,
fertility rate
and
net reproduction rate
, United Nations estimates
Population
,
fertility rate
and
net reproduction rate
, United Nations estimates
Demographic
features of the
population
of
Solomon Islands
include
population density
,
ethnicity
, education level, health of the populace, economic status, religious affiliations and other aspects.
Cultures, Languages and Customs
[
edit
]
The Solomon Islanders comprise diverse cultures, languages, and customs. Of its population
[1]
94.5% are
Melanesian
, 3%
Polynesian
, and 1.2%
Micronesian
.
[2]
In addition, small numbers of
Europeans
and
Chinese
are registered. About 120
vernaculars
are spoken.
Habitation
[
edit
]
Most people reside in small, widely dispersed settlements along the coasts. Sixty per cent live in localities with fewer than 200 persons, and only 10% reside in urban areas.
The capital city of
Honiara
is situated on
Guadalcanal
, the largest island. The other principal towns are
Gizo
,
Auki
, and
Kirakira
.
Religions
[
edit
]
Most Solomon Islanders are
Christian
, with the
Anglican
,
Methodist
,
Roman Catholic
,
South Seas Evangelical
, and
Seventh-day Adventist
faiths predominating. About 5% of the population maintain traditional beliefs.
The chief characteristics of the traditional Melanesian social structure are:
- The practice of
subsistence economy
;
- The recognition of bonds of kinship, with important obligations extending beyond the immediate family group;
- Generally egalitarian relationships, emphasising acquired rather than inherited status; and
- A strong attachment of the people to the land.
Most Solomon Islanders maintain this traditional social structure and find their roots in village life.
Vital statistics
[
edit
]
Births and deaths
[3]
[4]
|
|
Mid-year population (thousands)
|
Live births (thousands)
|
Deaths (thousands)
|
Natural change (thousands)
|
Crude birth rate (per 1000)
|
Crude death rate (per 1000)
|
Natural change (per 1000)
|
Total fertility rate
(TFR)
|
Infant mortality
(per 1000 live births)
|
Life expectancy
(in years)
|
| 1950
|
105,209
|
4,365
|
2,606
|
1,759
|
41.5
|
24.8
|
16.7
|
7.00
|
166.4
|
40.03
|
| 1951
|
107,119
|
4,519
|
2,536
|
1,983
|
42.2
|
23.7
|
18.5
|
7.02
|
163.8
|
40.53
|
| 1952
|
109,309
|
4,682
|
2,505
|
2,177
|
42.9
|
22.9
|
19.9
|
7.04
|
158.7
|
41.29
|
| 1953
|
111,760
|
4,816
|
2,472
|
2,344
|
43.1
|
22.1
|
21.0
|
7.01
|
153.7
|
42.08
|
| 1954
|
114,448
|
4,968
|
2,455
|
2,513
|
43.5
|
21.5
|
22.0
|
7.00
|
148.7
|
42.79
|
| 1955
|
117,314
|
5,119
|
2,432
|
2,687
|
43.7
|
20.8
|
22.9
|
6.99
|
143.8
|
43.58
|
| 1956
|
120,288
|
5,266
|
2,643
|
2,623
|
43.9
|
22.0
|
21.8
|
6.97
|
144.5
|
41.87
|
| 1957
|
123,373
|
5,415
|
2,366
|
3,049
|
43.9
|
19.2
|
24.7
|
6.95
|
132.9
|
45.28
|
| 1958
|
126,649
|
5,602
|
2,338
|
3,264
|
44.3
|
18.5
|
25.8
|
6.98
|
127.9
|
46.12
|
| 1959
|
130,071
|
5,774
|
2,315
|
3,459
|
44.4
|
17.8
|
26.6
|
6.97
|
123.0
|
46.91
|
| 1960
|
133,440
|
5,948
|
2,282
|
3,666
|
44.5
|
17.1
|
27.4
|
6.97
|
118.3
|
47.74
|
| 1961
|
136,780
|
6,085
|
2,291
|
3,794
|
44.4
|
16.7
|
27.7
|
6.97
|
113.6
|
48.43
|
| 1962
|
140,254
|
6,225
|
2,283
|
3,942
|
44.3
|
16.3
|
28.1
|
6.97
|
109.1
|
49.25
|
| 1963
|
143,863
|
6,357
|
2,274
|
4,083
|
44.1
|
15.8
|
28.3
|
6.97
|
104.6
|
50.05
|
| 1964
|
147,609
|
6,495
|
2,260
|
4,235
|
43.9
|
15.3
|
28.6
|
6.96
|
100.3
|
50.86
|
| 1965
|
151,495
|
6,624
|
2,246
|
4,378
|
43.7
|
14.8
|
28.9
|
6.95
|
96.0
|
51.66
|
| 1966
|
155,514
|
6,759
|
2,229
|
4,530
|
43.4
|
14.3
|
29.1
|
6.94
|
91.7
|
52.46
|
| 1967
|
159,667
|
6,901
|
2,216
|
4,685
|
43.2
|
13.9
|
29.3
|
6.94
|
87.5
|
53.21
|
| 1968
|
163,973
|
7,023
|
2,172
|
4,851
|
42.8
|
13.2
|
29.5
|
6.92
|
82.6
|
54.24
|
| 1969
|
168,399
|
7,224
|
2,141
|
5,083
|
42.8
|
12.7
|
30.1
|
6.97
|
78.0
|
55.16
|
| 1970
|
172,833
|
7,426
|
2,121
|
5,305
|
42.8
|
12.2
|
30.6
|
7.00
|
73.3
|
56.07
|
| 1971
|
177,264
|
7,604
|
2,116
|
5,488
|
42.8
|
11.9
|
30.9
|
7.03
|
68.9
|
56.98
|
| 1972
|
181,876
|
7,784
|
2,069
|
5,715
|
42.7
|
11.3
|
31.3
|
7.06
|
64.6
|
57.80
|
| 1973
|
186,816
|
7,995
|
2,027
|
5,968
|
42.7
|
10.8
|
31.9
|
7.09
|
60.7
|
58.59
|
| 1974
|
192,155
|
8,234
|
1,991
|
6,243
|
42.8
|
10.3
|
32.4
|
7.13
|
57.0
|
59.36
|
| 1975
|
197,853
|
8,395
|
2,161
|
6,234
|
42.4
|
10.9
|
31.5
|
7.07
|
56.2
|
58.08
|
| 1976
|
204,082
|
8,591
|
1,919
|
6,672
|
42.1
|
9.4
|
32.7
|
7.02
|
50.6
|
60.75
|
| 1977
|
210,932
|
8,824
|
1,937
|
6,887
|
41.8
|
9.2
|
32.7
|
6.95
|
48.3
|
60.86
|
| 1978
|
218,193
|
9,061
|
1,868
|
7,193
|
41.5
|
8.6
|
33.0
|
6.87
|
45.3
|
61.91
|
| 1979
|
225,786
|
9,303
|
1,864
|
7,439
|
41.2
|
8.3
|
33.0
|
6.78
|
43.3
|
62.39
|
| 1980
|
233,668
|
9,563
|
1,869
|
7,694
|
40.9
|
8.0
|
32.9
|
6.71
|
41.4
|
62.80
|
| 1981
|
241,827
|
9,817
|
1,881
|
7,936
|
40.6
|
7.8
|
32.8
|
6.61
|
39.8
|
63.16
|
| 1982
|
250,250
|
10,084
|
1,896
|
8,188
|
40.3
|
7.6
|
32.7
|
6.52
|
38.4
|
63.51
|
| 1983
|
258,945
|
10,369
|
1,924
|
8,445
|
40.1
|
7.4
|
32.6
|
6.42
|
37.1
|
63.76
|
| 1984
|
267,913
|
10,660
|
1,955
|
8,705
|
39.8
|
7.3
|
32.5
|
6.31
|
36.0
|
64.00
|
| 1985
|
277,158
|
10,969
|
1,981
|
8,988
|
39.6
|
7.2
|
32.4
|
6.22
|
35.0
|
64.29
|
| 1986
|
286,527
|
11,280
|
2,121
|
9,159
|
39.4
|
7.4
|
32.0
|
6.11
|
35.3
|
63.76
|
| 1987
|
295,836
|
11,536
|
2,039
|
9,497
|
39.0
|
6.9
|
32.1
|
5.99
|
33.2
|
64.76
|
| 1988
|
305,132
|
11,818
|
2,063
|
9,755
|
38.7
|
6.8
|
31.9
|
5.88
|
32.5
|
64.97
|
| 1989
|
314,560
|
12,091
|
2,093
|
9,998
|
38.4
|
6.6
|
31.7
|
5.78
|
31.7
|
65.19
|
| 1990
|
324,171
|
12,353
|
2,125
|
10,228
|
38.1
|
6.5
|
31.5
|
5.66
|
31.0
|
65.39
|
| 1991
|
333,952
|
12,615
|
2,160
|
10,455
|
37.7
|
6.5
|
31.3
|
5.55
|
30.3
|
65.58
|
| 1992
|
343,916
|
12,898
|
2,197
|
10,701
|
37.5
|
6.4
|
31.1
|
5.45
|
29.5
|
65.77
|
| 1993
|
354,086
|
13,248
|
2,237
|
11,011
|
37.4
|
6.3
|
31.1
|
5.38
|
28.8
|
65.96
|
| 1994
|
364,505
|
13,622
|
2,272
|
11,350
|
37.3
|
6.2
|
31.1
|
5.31
|
28.1
|
66.19
|
| 1995
|
375,189
|
13,988
|
2,315
|
11,673
|
37.2
|
6.2
|
31.1
|
5.24
|
27.5
|
66.38
|
| 1996
|
386,069
|
14,209
|
2,354
|
11,855
|
36.8
|
6.1
|
30.7
|
5.12
|
26.9
|
66.59
|
| 1997
|
397,050
|
14,391
|
2,402
|
11,989
|
36.2
|
6.0
|
30.2
|
4.99
|
26.5
|
66.74
|
| 1998
|
408,145
|
14,686
|
2,449
|
12,237
|
35.9
|
6.0
|
29.9
|
4.90
|
26.1
|
66.92
|
| 1999
|
419,229
|
14,967
|
2,502
|
12,465
|
35.6
|
6.0
|
29.7
|
4.82
|
25.7
|
67.07
|
| 2000
|
429,978
|
15,207
|
2,560
|
12,647
|
35.3
|
5.9
|
29.3
|
4.76
|
25.3
|
67.23
|
| 2001
|
440,395
|
15,457
|
2,615
|
12,842
|
35.0
|
5.9
|
29.1
|
4.69
|
25.1
|
67.36
|
| 2002
|
450,760
|
15,672
|
2,667
|
13,005
|
34.7
|
5.9
|
28.8
|
4.63
|
24.8
|
67.52
|
| 2003
|
461,216
|
15,914
|
2,722
|
13,192
|
34.4
|
5.9
|
28.5
|
4.57
|
24.6
|
67.64
|
| 2004
|
471,785
|
16,146
|
2,770
|
13,376
|
34.1
|
5.9
|
28.3
|
4.52
|
24.4
|
67.80
|
| 2005
|
482,486
|
16,400
|
2,821
|
13,579
|
33.9
|
5.8
|
28.1
|
4.48
|
24.2
|
67.94
|
| 2006
|
493,430
|
16,834
|
2,870
|
13,964
|
34.0
|
5.8
|
28.2
|
4.48
|
23.9
|
68.09
|
| 2007
|
504,619
|
17,123
|
2,968
|
14,155
|
33.8
|
5.9
|
28.0
|
4.44
|
23.8
|
67.99
|
| 2008
|
516,001
|
17,424
|
2,958
|
14,466
|
33.7
|
5.7
|
27.9
|
4.41
|
23.0
|
68.40
|
| 2009
|
527,833
|
17,763
|
3,024
|
14,739
|
33.6
|
5.7
|
27.8
|
4.39
|
22.9
|
68.47
|
| 2010
|
540,394
|
18,223
|
3,041
|
15,182
|
33.6
|
5.6
|
28.0
|
4.40
|
22.0
|
68.73
|
| 2011
|
553,721
|
18,661
|
3,076
|
15,585
|
33.6
|
5.5
|
28.1
|
4.41
|
21.4
|
68.91
|
| 2012
|
567,763
|
19,122
|
3,110
|
16,012
|
33.6
|
5.5
|
28.2
|
4.41
|
20.8
|
69.08
|
| 2013
|
582,365
|
19,592
|
3,162
|
16,430
|
33.6
|
5.4
|
28.2
|
4.42
|
20.3
|
69.19
|
| 2014
|
597,375
|
20,031
|
3,235
|
16,796
|
33.5
|
5.4
|
28.1
|
4.42
|
20.4
|
69.23
|
| 2015
|
612,660
|
20,203
|
3,227
|
16,976
|
32.9
|
5.3
|
27.7
|
4.36
|
19.1
|
69.58
|
| 2016
|
628,102
|
20,365
|
3,255
|
17,110
|
32.4
|
5.2
|
27.2
|
4.29
|
18.5
|
69.80
|
| 2017
|
643,634
|
20,458
|
3,293
|
17,165
|
31.7
|
5.1
|
26.6
|
4.22
|
18.0
|
69.99
|
| 2018
|
659,249
|
20,608
|
3,335
|
17,273
|
31.2
|
5.1
|
26.2
|
4.16
|
17.4
|
70.17
|
| 2019
|
674,993
|
20,791
|
3,372
|
17,419
|
30.8
|
5.0
|
25.8
|
4.10
|
16.9
|
70.38
|
| 2020
|
691,191
|
20,904
|
3,515
|
17,389
|
30.2
|
5.1
|
25.1
|
4.04
|
16.5
|
70.20
|
| 2021
|
707,851
|
21,098
|
3,561
|
17,537
|
29.8
|
5.0
|
24.8
|
3.98
|
15.8
|
70.35
|
Structure of the population
[
edit
]
Population by Sex and Age Group (Census 22.XI.2009):
[5]
| Age Group
|
Male
|
Female
|
Total
|
%
|
| Total
|
264 455
|
251 415
|
515 870
|
100
|
| 0?4
|
39 728
|
36 499
|
76 227
|
14.78
|
| 5?9
|
36 974
|
34 152
|
71 126
|
13.79
|
| 10?14
|
32 562
|
29 369
|
61 931
|
12.01
|
| 15?19
|
26 189
|
25 023
|
51 212
|
9.93
|
| 20?24
|
22 399
|
23 020
|
45 419
|
8.80
|
| 25?29
|
20 794
|
21 880
|
42 674
|
8.27
|
| 30?34
|
18 807
|
18 785
|
37 592
|
7.29
|
| 35?39
|
17 010
|
16 141
|
33 151
|
6.43
|
| 40?44
|
12 070
|
11 568
|
23 638
|
4.58
|
| 45?49
|
10 189
|
9 524
|
19 713
|
3.82
|
| 50?54
|
7 498
|
6 841
|
14 339
|
2.78
|
| 55?59
|
6 111
|
5 676
|
11 787
|
2.28
|
| 60?64
|
4 535
|
4 381
|
8 916
|
1.73
|
| 65-69
|
3 693
|
3 328
|
7 021
|
1.36
|
| 70-74
|
2 402
|
2 296
|
4 698
|
0.91
|
| 75-79
|
1 784
|
1 590
|
3 374
|
0.65
|
| 80-84
|
800
|
725
|
1 525
|
0.30
|
| 85-89
|
512
|
382
|
894
|
0.17
|
| 90-94
|
170
|
131
|
301
|
0.06
|
| 95+
|
228
|
104
|
332
|
0.06
|
| Age group
|
Male
|
Female
|
Total
|
Per cent
|
| 0?14
|
109 264
|
100 020
|
209 284
|
40.57
|
| 15?64
|
145 602
|
142 839
|
288 441
|
55.91
|
| 65+
|
9 589
|
8 556
|
18 145
|
3.52
|
Population Estimates by Sex and Age Group (01.VII.2021) (Projections based on adjusted 2009 census counts.):
[5]
| Age Group
|
Male
|
Female
|
Total
|
%
|
| Total
|
360 961
|
346 523
|
707 484
|
100
|
| 0?4
|
42 814
|
40 013
|
82 826
|
11.71
|
| 5?9
|
42 227
|
39 814
|
82 041
|
11.60
|
| 10?14
|
41 682
|
39 525
|
81 206
|
11.48
|
| 15?19
|
39 816
|
37 593
|
77 409
|
10.94
|
| 20?24
|
34 052
|
31 980
|
66 032
|
9.33
|
| 25?29
|
28 304
|
26 540
|
54 843
|
7.75
|
| 30?34
|
25 926
|
24 335
|
50 261
|
7.10
|
| 35?39
|
23 401
|
22 340
|
45 740
|
6.47
|
| 40?44
|
19 810
|
19 951
|
39 760
|
5.62
|
| 45?49
|
17 196
|
17 749
|
34 945
|
4.94
|
| 50?54
|
13 460
|
13 628
|
27 088
|
3.83
|
| 55?59
|
10 280
|
10 328
|
20 608
|
2.91
|
| 60?64
|
7 637
|
7 601
|
15 238
|
2.15
|
| 65-69
|
5 588
|
5 656
|
11 243
|
1.59
|
| 70-74
|
3 905
|
4 262
|
8 167
|
1.15
|
| 75-79
|
2 596
|
2 800
|
5 396
|
0.76
|
| 80+
|
2 269
|
2 411
|
4 679
|
0.66
|
| Age group
|
Male
|
Female
|
Total
|
Per cent
|
| 0?14
|
126 723
|
119 352
|
246 075
|
34.78
|
| 15?64
|
219 880
|
212 042
|
431 922
|
61.05
|
| 65+
|
14 358
|
15 129
|
29 487
|
4.17
|
The World Factbook demographic statistics
[
edit
]
The following demographic statistics are from
The World Factbook
, unless otherwise indicated.
[6]
 Demographics of Solomon Islands, Data of
FAO
, year 2005; Number of inhabitants in thousands.
Demographics of Solomon Islands, Data of
FAO
, year 2005; Number of inhabitants in thousands.
Population
[
edit
]
Age structure
[
edit
]
- 0?14 years: 32.99% (male 116,397/female 109,604)
- 15?24 years: 19.82% (male 69,914/female 65,874)
- 25?54 years: 37.64% (male 131,201/female 126,681)
- 55?64 years: 5.04% (male 17,844/female 16,704)
- 65 years and over: 4.51% (male 14,461/female 16,417) (2020 est.)
Population growth rate
[
edit
]
Birth rate
[
edit
]
- 23.6 births/1,000 population
Death rate
[
edit
]
- 3.8 deaths/1,000 population
Net migration rate
[
edit
]
- -1.6 migrant(s)/1,000 population
Urbanisation
[
edit
]
- Urban Population: 24.7% of total population
- Rate of Urbanization: 3.91% annual rate of change
Sex ratio
[
edit
]
- At Birth: 1.05 male(s)/female
- 0?14 years: 1.06 male(s)/female
- 15?24 years: 1.06 male(s)/female
- 25?54 years: 1.04 male(s)/female
- 55?64 years: 1.07 male(s)/female
- 65 years and over: 0.88 male(s)/female
- Total Population: 1.04 male(s)/female (2020 est.)
Maternal mortality rate
[
edit
]
- 104 deaths/100,000 live births
Life expectancy at birth
[
edit
]
- Total population: 76.2 years
- Male: 73.5 years
- Female: 79 years (2020 est.)
Total fertility rate
[
edit
]
- 2.97 children born/woman (2020 est.)
Health expenditure
[
edit
]
Physicians density
[
edit
]
- 0.2 physicians/1,000 population
Hospital bed density
[
edit
]
- 1.4 beds/1,000 population
Nationality
[
edit
]
- Solomon Islanders (noun)
- Solomon Islander (adjective)
Ethnic groups
[
edit
]
Religions
[
edit
]
Languages
[
edit
]
Literacy
[
edit
]
- Total population: 84.1%
- Male: 88.9%
- Female: 79.2%
References
[
edit
]
|
|---|
| Sovereign states
| |
|---|
Associated states
of New Zealand
| |
|---|
Dependencies
and other territories
| |
|---|