Overview of the climate of Australia
 Koppen climate types
in
Australia
Koppen climate types
in
Australia
Australia's climate
is governed mostly by its size and by the hot, sinking air of the
subtropical
high pressure
belt
(subtropical ridge
or
Australian High
). This moves north-west and north-east with the seasons. The climate is variable, with frequent droughts lasting several seasons, thought to be caused in part by the
El Nino-Southern Oscillation
. Australia has a wide variety of climates due to its large geographical size. The largest part of Australia is
desert
or
semi-arid
. Only the south-east and south-west corners have a
temperate climate
and moderately
fertile soil
. The northern part of the country has a
tropical climate
, varying between
grasslands
and desert. Australia holds many heat-related records: the continent has the hottest extended region year-round, the areas with the hottest summer climate, and the highest sunshine duration.
Because Australia is a medium-sized continent, separated from polar regions by the
Southern Ocean
, it is not subject to movements of frigid polar air during winter, of the type that sweep over the continents in the northern hemisphere during their winter. Consequently, Australia's winter is relatively mild, with less contrast between summer and winter temperatures than in the northern continents–though the transition is more dramatically marked in alpine regions of Australia and places of substantial elevation. Seasonal highs and lows can still be considerable. Temperatures have ranged from above 50 °C (122 °F) to as low as ?23.0 °C (?9.4 °F). Minimum temperatures are moderated.
The El Nino?Southern Oscillation is associated with seasonal abnormality in many areas in the world. Australia is one of the
continents
most affected and experiences
extensive droughts
alongside considerable wet periods. Occasionally a
dust storm
will blanket a region and there are reports of the occasional
tornado
. Tropical cyclones,
heat waves
,
bushfires
and
frosts
in the country are also associated with the Southern Oscillation. Rising levels of
salinity
and
desertification
in some areas is ravaging the landscape.
Climate change in Australia
is a highly contentious political issue.
[1]
[2]
Temperatures in the country rose by approximately 0.7 °C between 1910 and 2004, following an
increasing trend of global warming
.
[3]
Overnight minimum temperatures have warmed more rapidly than daytime maximum temperatures in recent years. The late-20th century warming has been largely attributed to the increased
greenhouse effect
.
[4]
According to the
Bureau of Meteorology
(BOM), 80% of the land receives less than 600 mm (24 in) of rainfall annually and 50% has even less than 300 mm (12 in).
[5]
As a whole, Australia has a very low annual average rainfall of 419 mm (16 in).
[6]
States and territories
Australian Capital Territory
 Light snow on
Mount Tennent
, which features dry
sclerophyll
woodlands.
Light snow on
Mount Tennent
, which features dry
sclerophyll
woodlands.
 Autumn foliage
in
Canberra
.
Autumn foliage
in
Canberra
.
Because of its higher general elevation of over 650 m (2,130 ft), southern latitude and entirely landlocked location, winters are exclusively cool to cold in the Australian Capital Territory.
Canberra
has warm to hot, dry summers with some thunderstorms.
[7]
Heavy
frosts
are commonplace and
radiation fog
often occurs. Many of the higher mountains to the territory's west are snow-covered for a large part of the winter and early spring. Thunderstorms can occur between October and March, and annual rainfall is 623 mm (25 in), with rainfall highest in spring and summer and lowest in winter. The region is dry throughout its entirety due to its position on the
leeward
side of the
Brindabella Ranges
.
The highest temperature recorded in the ACT was 44.0 °C (111.2 °F) at
Canberra Airport
on 4 January 2020.
[8]
The lowest temperature was ?14.6 °C (5.7 °F) at
Gudgenby
on 11 July 1971.
[9]
New South Wales
 Koppen climate classification map of New South Wales
 Temperate
grasslands
in the
Kangaroo Valley
, typical along the eastern coast of the state.
Temperate
grasslands
in the
Kangaroo Valley
, typical along the eastern coast of the state.
 Autumn at
Mount Wilson
.
Autumn at
Mount Wilson
.
Over half of
New South Wales
has an
arid
or
semi-arid climate
. The eastern portion has a
temperate climate
, ranging from
humid subtropical
from its northern border to the
Central Coast
and most of Sydney, and
oceanic
to the south coast. The
Snowy Mountains
region in the south-east falls in the
alpine climate
or
subpolar oceanic climate
zone, with cool to cold weather all year around and regular heavy snowfalls in the winter and spring. Further inland, the climate is semi-arid and a
desert climate
towards the western part of the state.
The weather in the southern half of the state is generally warm to hot in summer and cool in the winter. The seasons are more defined in the southern half of the state, especially in the
South West Slopes
,
Central West
and the
Riverina
regions. On the coast and anywhere east of the dividing range, a summer rainfall peak is observed throughout its entire latitudinal span. On the ranges and farther inland, rainfall usually peaks in spring in most parts of the state; though the South West Slopes region, in the south-central part of the state (bordering
Victoria
), has a distinct winter rainfall peak; whereas the New England and
North West Slopes
regions have a summer rainfall peak. On a hot summer day, a
southerly buster
may at times moderate the extreme heat experienced in the coastal New South Wales region, from
Port Macquarie
southwards to
Nowra
.
[10]
The warmest region by annual maxima is the
north-west
, where summers are extremely hot, but winters relatively cooler and dry. The weather in the
northeast region
of the state, or the
North Coast
, bordering
Queensland
, is moderately hot, humid and rainy in the summer, and mild in winter with more sunshine; and little seasonal temperature difference. The
Northern Tablelands
have relatively milder summers and colder winters, due to their high elevation and inland location on the
Great Dividing Range
. The southeast
coastal plain
, which lies on the
leeward
side of the Great Dividing Range, experiences
foehn winds
, particularly between winter and spring, which can elevate fire danger.
[11]
The coldest region is the
Snowy Mountains
where the snow and ice continues for a long period during the winter months. The
Blue Mountains
,
Southern Tablelands
and
Central Tablelands
, which are situated on the Great Dividing Range, have mild to warm summers and cold winters, although not as severe as those in the Snowy Mountains. The areas situated in the valleys of the range, such as
Bathurst
,
Goulburn
and
Bowral
, among other places, have recorded freezing and/or near-freezing lows even in the summer months, unlike other places of similar latitude and altitude in the northern hemisphere.
The highest maximum temperature recorded was 49.7 °C (121.5 °F) at
Menindee
in the state's west on 10 January 1939. The lowest minimum temperature was ?23.0 °C (?9.4 °F) at
Charlotte Pass
on 29 June 1994 in the Snowy Mountains. This is also the lowest temperature recorded in the whole of Australia excluding
Australian Antarctic Territory
.
[12]
Rainfall varies throughout the state. The far northwest receives the least, less than 180 mm (7 in) annually, while the east receives between 600 and 1,200 mm (24 and 47 in) of rain.
 Labelled map of New South Wales showing where the places mentioned in the table are located
| Place
|
Climate type
|
January mean max. temp
|
January mean min. temp
|
July mean max. temp
|
July mean min. temp
|
No. clear days
|
Annual precipitation
|
| Albury
[13]
|
Cfa
|
31 °C (88 °F)
|
17 °C (63 °F)
|
12 °C (54 °F)
|
4 °C (39 °F)
|
108
|
699 mm (28 in)
|
| Armidale
[14]
|
Cfb
|
26 °C (79 °F)
|
14 °C (57 °F)
|
12 °C (54 °F)
|
1 °C (34 °F)
|
106
[15]
|
743 mm (29 in)
|
| Broken Hill
[16]
|
BWh
|
33 °C (91 °F)
|
19 °C (66 °F)
|
15 °C (59 °F)
|
5 °C (41 °F)
|
137
|
245 mm (10 in)
|
| Charlotte Pass
[17]
|
Cfc
/
Dfc
|
18 °C (64 °F)
|
5 °C (41 °F)
|
2 °C (36 °F)
|
?7 °C (19 °F)
|
78
|
1,948 mm (77 in)
|
| Coffs Harbour
[18]
|
Cfa
|
27 °C (81 °F)
|
20 °C (68 °F)
|
19 °C (66 °F)
|
8 °C (46 °F)
|
122
|
1,668 mm (66 in)
|
| Orange
[19]
|
Cfb
|
27 °C (81 °F)
|
13 °C (55 °F)
|
10 °C (50 °F)
|
2 °C (36 °F)
|
100
|
927 mm (36 in)
|
| Penrith
[20]
|
Cfa
|
31 °C (88 °F)
|
18 °C (64 °F)
|
18 °C (64 °F)
|
5 °C (41 °F)
|
103
|
696 mm (27 in)
|
| Sydney
[21]
(capital)
|
Cfa
|
27 °C (81 °F)
|
20 °C (68 °F)
|
17 °C (63 °F)
|
9 °C (48 °F)
|
104
|
1,150 mm (45 in)
|
| Wagga Wagga
[22]
|
Cfa
|
32 °C (90 °F)
|
16 °C (61 °F)
|
13 °C (55 °F)
|
3 °C (37 °F)
|
124
|
566 mm (22 in)
|
| Wollongong
[23]
|
Cfb
|
26 °C (79 °F)
|
18 °C (64 °F)
|
17 °C (63 °F)
|
8 °C (46 °F)
|
107
|
1,346 mm (53 in)
|
Northern Territory
 Koppen map of the Northern Territory
Average monthly maximum
temperature in Northern Territory
|
| Month
|
Darwin
|
Alice Springs
|
| January
|
31.8 °C (89.2 °F)
|
36.4 °C (97.5 °F)
|
| February
|
31.4 °C (88.5 °F)
|
35.1 °C (95.2 °F)
|
| March
|
31.9 °C (89.4 °F)
|
32.7 °C (90.9 °F)
|
| April
|
32.7 °C (90.9 °F)
|
28.2 °C (82.8 °F)
|
| May
|
32.0 °C (89.6 °F)
|
23.0 °C (73.4 °F)
|
| June
|
30.6 °C (87.1 °F)
|
19.8 °C (67.6 °F)
|
| July
|
30.5 °C (86.9 °F)
|
19.7 °C (67.5 °F)
|
| August
|
31.3 °C (88.3 °F)
|
22.5 °C (72.5 °F)
|
| September
|
32.5 °C (90.5 °F)
|
27.2 °C (81.0 °F)
|
| October
|
33.2 °C (91.8 °F)
|
31.0 °C (87.8 °F)
|
| November
|
33.3 °C (91.9 °F)
|
33.6 °C (92.5 °F)
|
| December
|
32.6 °C (90.7 °F)
|
35.4 °C (95.7 °F)
|
| Source: Bureau of Meteorology
[24]
[25]
|
The
Northern Territory
has two distinctive climate zones. The northern end, including
Darwin
, has a
tropical savannah climate
(
Koppen
Aw
)
[26]
with high humidity and two seasons, the wet (October to April) and dry season (May to September). During the dry season nearly every day is warm and sunny, and afternoon humidity averages around 30%. There is very little rainfall between May and September. In the coolest months of June and July, the daily minimum temperature may dip as low as 14 °C (57 °F), but very rarely lower, and frost has never been recorded.
The wet season is associated with
tropical cyclones
and
monsoon
rains. The majority of rainfall occurs between December and March (the
Southern Hemisphere
summer), when thunderstorms are common and afternoon relative humidity averages over 70% during the wettest months. On average more than 1,570 mm (62 in) of rain falls in the north. Thunderstorms can produce spectacular
lightning
displays.
 Monsoonal squall nears Darwin
The rest of the territory lies in the desert centre of the country; it includes
Alice Springs
and
Uluru
, and is arid or semi-arid with little rain usually falling during the hottest months from October to March. Its seasons are more defined than the northern parts, with summers being very hot, with average temperatures often exceeding 35 °C (95 °F), and winters relatively cool with average minimum temperatures dipping as low as 5 °C (41 °F), with a few frosty nights. Central Australia receives less than 250 mm (10 in) of annual rainfall.
The highest maximum temperature recorded in the territory was 48.3 °C (118.9 °F) at
Finke
on 1 and 2 January 1960. The lowest minimum temperature was ?7.5 °C (18.5 °F) at Alice Springs on 12 July 1976.
[12]
Queensland
 Koppen map of Queensland
Because of its size, there is significant variation in climate across the state. Low rainfall and hot summers are typical for the inland west, a monsoonal 'wet' season in the far north, and warm
subtropical
conditions along the coastal strip. Inland and in southern ranges cooler temperatures are experienced, especially at nights. The climate of the coastal strip is influenced by warm ocean waters, keeping the region free from extremes of temperature and providing moisture for rainfall.
[27]
There are five predominant climatic zones in Queensland,
[28]
based on temperature and humidity:
- hot humid summer (far north and coastal)
- warm humid summer (coastal elevated hinterlands and coastal south-east)
- hot dry summer, mild winter (central west)
- hot dry summer, cold winter (southern west)
- temperate ? warm summer, cold winter (inland south-east, e.g.
Granite Belt
)
 Grassland typical of Queensland and mountain ranges near
Proserpine
Grassland typical of Queensland and mountain ranges near
Proserpine
However, most of the Queensland populace experience two weather seasons: a winter period of rather warm temperatures with minimal rainfall, and a sultry summer period of hot, sticky temperatures and more rain.
The highest maximum temperature observed in the state is 49.5 °C (121.1 °F) at
Birdsville
on 24 December 1972. The temperature of 53.1 °C (127.6 °F) at
Cloncurry
on 16 January 1889 is not considered official; the figure quoted from Birdsville is the next highest, so that record is considered as being official.
The lowest minimum temperature is ?10.6 °C (12.9 °F) at
Stanthorpe
on 23 June 1961 and at The Hermitage on 12 July 1965.
[12]
 Labelled map of Queensland showing where the places mentioned in the table are located
| Place
|
Climate type
|
January max. temp
|
January min. temp
|
July max. Temp
|
July min. temp
|
No. clear days
|
Annual precipitation
|
| Birdsville
[29]
|
BWh
|
39 °C (102 °F)
|
24 °C (75 °F)
|
21 °C (70 °F)
|
7 °C (45 °F)
|
221
|
164 mm (6 in)
|
| Brisbane
[30]
(capital)
|
Cfa
|
30 °C (86 °F)
|
21 °C (70 °F)
|
22 °C (72 °F)
|
10 °C (50 °F)
|
123
|
1,022 mm (40 in)
|
| Cairns
[31]
|
Am
|
32 °C (90 °F)
|
24 °C (75 °F)
|
26 °C (79 °F)
|
17 °C (63 °F)
|
90
|
1,982 mm (78 in)
|
| Gold Coast
[32]
|
Cfa
|
29 °C (84 °F)
|
22 °C (72 °F)
|
21 °C (70 °F)
|
12 °C (54 °F)
|
N/A
|
1,273 mm (50 in)
|
| Mackay
[33]
|
Cfa
|
30 °C (86 °F)
|
24 °C (75 °F)
|
21 °C (70 °F)
|
13 °C (55 °F)
|
123
|
1,610 mm (63 in)
|
| Mount Isa
[34]
|
BSh
|
37 °C (99 °F)
|
24 °C (75 °F)
|
25 °C (77 °F)
|
9 °C (48 °F)
|
175
|
462 mm (18 in)
|
| Rockhampton
[35]
|
Cfa
|
32 °C (90 °F)
|
22 °C (72 °F)
|
23 °C (73 °F)
|
10 °C (50 °F)
|
116
|
812 mm (32 in)
|
| Stanthorpe
[36]
|
Cfb
|
27 °C (81 °F)
|
16 °C (61 °F)
|
15 °C (59 °F)
|
1 °C (34 °F)
|
42
|
762 mm (30 in)
|
| Toowoomba
[37]
|
Cfa
|
28 °C (82 °F)
|
17 °C (63 °F)
|
16 °C (61 °F)
|
5 °C (41 °F)
|
114
|
952 mm (37 in)
|
| Townsville
[38]
|
Aw
|
31 °C (88 °F)
|
24 °C (75 °F)
|
25 °C (77 °F)
|
14 °C (57 °F)
|
121
|
1,132 mm (45 in)
|
| Weipa
[39]
|
Aw
|
32 °C (90 °F)
|
24 °C (75 °F)
|
31 °C (88 °F)
|
19 °C (66 °F)
|
54
|
1,911 mm (75 in)
|
South Australia
 Koppen map of South Australia
The majority of the state has the
arid
and
semi-arid climates
. The southern coastal parts of the state have a
Mediterranean climate
with mild wet winters and hot dry summers. The highest rainfall occurs along the southern coasts and the
Mount Lofty
Ranges (with an average annual rainfall of 1,200 millimetres (47 in) in the vicinity of
Mount Lofty
); the lowest rainfall occurs in the
Lake Eyre basin
where the average annual totals are less than 150 millimetres (6 in) and possibly even 100 millimetres (4 in). Most of the rain in the southern districts of the State fall during the winter months when the sub-tropical high-pressure belt is displaced to the north over the Australian continent.
[40]
 Typical desert landscape north of
Coober Pedy
Typical desert landscape north of
Coober Pedy
South Australia's mean temperature range is 29 °C (84 °F) in January and 15 °C (59 °F) in July. Daily temperatures in parts of the state in January and February can be up to 50 °C (122 °F). The highest maximum temperature was recorded as 50.7 °C (123.3 °F) at
Oodnadatta
on 2 January 1960, which is the highest official temperature recorded in Australia. The lowest minimum temperature was ?8.0 °C (17.6 °F) at
Yongala
on 20 July 1976.
[12]
 Labelled map of South Australia showing where the places mentioned in the table are located
| Place
|
Climate type
|
January max. temp
|
January min. temp
|
July max. temp
|
July min. temp
|
No. clear days
|
Annual precipitation
|
| Adelaide
[41]
(capital)
|
Csa
|
29 °C (84 °F)
|
17 °C (63 °F)
|
15 °C (59 °F)
|
7 °C (45 °F)
|
87
|
551 mm (22 in)
|
| Kingscote
[42]
|
Csb
|
24 °C (75 °F)
|
15 °C (59 °F)
|
15 °C (59 °F)
|
8 °C (46 °F)
|
62
|
489 mm (19 in)
|
| Mount Gambier
[43]
|
Csb
|
25 °C (77 °F)
|
11 °C (52 °F)
|
13 °C (55 °F)
|
5 °C (41 °F)
|
40
|
710 mm (28 in)
|
| Oodnadatta
[44]
|
BWh
|
38 °C (100 °F)
|
23 °C (73 °F)
|
20 °C (68 °F)
|
6 °C (43 °F)
|
182
|
176 mm (7 in)
|
| Port Augusta
[45]
|
BWh
|
34 °C (93 °F)
|
19 °C (66 °F)
|
18 °C (64 °F)
|
5 °C (41 °F)
|
142
|
218 mm (9 in)
|
| Stirling
[46]
|
Csb
/
Cfb
|
25 °C (77 °F)
|
12 °C (54 °F)
|
11 °C (52 °F)
|
5 °C (41 °F)
|
71
|
1,107 mm (44 in)
|
| Whyalla
[47]
|
BSh
|
30 °C (86 °F)
|
18 °C (64 °F)
|
17 °C (63 °F)
|
5 °C (41 °F)
|
63
|
267 mm (11 in)
|
Tasmania
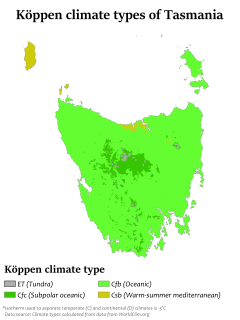 Koppen-Geiger climate types of Tasmania
Tasmania
has a cool temperate climate, with most areas under an
oceanic climate
(
Cfb
), with four distinct seasons. Summer lasts from December to February when the average maximum sea temperature is 21 °C (70 °F) and inland areas around
Launceston
reach 24 °C (75 °F). Other inland areas are much cooler;
Liawenee
, located on the
Central Plateau
, is one of the coldest places in Australia with February temperatures ranging between 4 and 17 °C (39 and 63 °F). Autumn lasts between March and May and experiences changeable weather, where summer weather patterns gradually take on the shape of winter patterns.
[48]
The highest recorded maximum temperature in Tasmania was 42.2 °C (108.0 °F) at
Scamander
on 30 January 2009, during the
2009 south-eastern Australia heat wave
. Tasmania's lowest recorded minimum temperature was ?14.2 °C (6.4 °F) on 7 August 2020, at Liawenee.
[49]
 Map of Tasmania with the locations shown in the table labelled
| Place
|
Climate type
|
January max. temp
|
January min. temp
|
July max. temp
|
July min. temp
|
No. clear days
|
Annual precipitation
|
| Burnie
[50]
|
Cfb
|
21 °C (70 °F)
|
13 °C (55 °F)
|
13 °C (55 °F)
|
6 °C (43 °F)
|
52
|
958 mm (38 in)
|
| Devonport
[51]
|
Csb
|
21 °C (70 °F)
|
12 °C (54 °F)
|
13 °C (55 °F)
|
5 °C (41 °F)
|
56
|
773 mm (30 in)
|
| Flinders Island
[52]
|
Cfb
|
22 °C (72 °F)
|
14 °C (57 °F)
|
13 °C (55 °F)
|
6 °C (43 °F)
|
47
|
741 mm (29 in)
|
| Hobart
[53]
(capital)
|
Cfb
|
22 °C (72 °F)
|
12 °C (54 °F)
|
12 °C (54 °F)
|
5 °C (41 °F)
|
41
|
615 mm (24 in)
|
| King Island
[54]
|
Csb
|
21 °C (70 °F)
|
13 °C (55 °F)
|
13 °C (55 °F)
|
8 °C (46 °F)
|
20
|
854 mm (34 in)
|
| Launceston
[55]
|
Cfb
|
25 °C (77 °F)
|
11 °C (52 °F)
|
12 °C (54 °F)
|
2 °C (36 °F)
|
50
|
630 mm (25 in)
|
| Liawenee
[56]
|
Csc
|
19 °C (66 °F)
|
6 °C (43 °F)
|
6 °C (43 °F)
|
?2 °C (28 °F)
|
22
|
923 mm (36 in)
|
| Queenstown
[57]
|
Cfb
|
21 °C (70 °F)
|
8 °C (46 °F)
|
12 °C (54 °F)
|
2 °C (36 °F)
|
29
|
2,405 mm (95 in)
|
| St Helens
[58]
|
Cfb
|
23 °C (73 °F)
|
13 °C (55 °F)
|
14 °C (57 °F)
|
5 °C (41 °F)
|
N/A
|
666 mm (26 in)
|
| Strahan
[59]
|
Cfb
|
21 °C (70 °F)
|
11 °C (52 °F)
|
12 °C (54 °F)
|
5 °C (41 °F)
|
16
|
1,544 mm (61 in)
|
Victoria
 A
temperate rainforest
in
Great Otway National Park
, in the
southwest
region of the state
A
temperate rainforest
in
Great Otway National Park
, in the
southwest
region of the state
Average monthly maximum
temperature in Victoria
|
| Month
|
Melbourne
|
Mildura
|
| January
|
25.8 °C (78.4 °F)
|
32.8 °C (91.0 °F)
|
| February
|
25.8 °C (78.4 °F)
|
32.7 °C (90.9 °F)
|
| March
|
23.8 °C (74.8 °F)
|
29.3 °C (84.7 °F)
|
| April
|
20.2 °C (68.4 °F)
|
24.1 °C (75.4 °F)
|
| May
|
16.6 °C (61.9 °F)
|
19.6 °C (67.3 °F)
|
| June
|
14.0 °C (57.2 °F)
|
16.0 °C (60.8 °F)
|
| July
|
13.4 °C (56.1 °F)
|
15.4 °C (59.7 °F)
|
| August
|
14.9 °C (58.8 °F)
|
17.7 °C (63.9 °F)
|
| September
|
17.2 °C (63.0 °F)
|
21.1 °C (70.0 °F)
|
| October
|
19.6 °C (67.3 °F)
|
25.0 °C (77.0 °F)
|
| November
|
21.8 °C (71.2 °F)
|
29.0 °C (84.2 °F)
|
| December
|
24.1 °C (75.4 °F)
|
31.7 °C (89.1 °F)
|
| Source: BOM
|
Victoria has a varied climate despite its small size. It ranges from semi-arid and hot in the north-west, to temperate and cool along the coast. Victoria's main land feature, the
Great Dividing Range
, produces a cooler, mountain climate in the centre and east of the state.
The coastal plain south of the Great Dividing Range has Victoria's mildest climate. Regular frontal systems off the Southern Ocean significantly mitigate the heat of summer. Melbourne and other large cities are located in this temperate region.
The Mallee
and upper
Wimmera
are Victoria's warmest regions with hot winds blowing from nearby deserts. Average temperatures top 32 °C (90 °F) during summer and 15 °C (59 °F) in winter. Victoria's highest maximum temperature of 48.8 °C (119.8 °F) was recorded in
Hopetoun
on 7 February 2009, during the 2009 south-eastern Australia heat wave.
[12]
A
screen
temperature of 50.7 °C (123.3 °F) was recorded on 7 January 1906 in
Mildura
.
[60]
[61]
The
Victorian Alps
in the eastern and central regions constitute the coldest climate of Victoria. The Alps are part of the Great Dividing Range extending longitudinally through the centre of Victoria. Average maximum temperatures are less than 9 °C (48 °F) in winter; below 0 °C (32 °F) in the highest parts of the ranges. The state's lowest minimum temperature of ?11.7 °C (10.9 °F) was recorded at
Omeo
on 13 June 1965, and again at
Falls Creek
on 3 July 1970.
[12]
Victoria is the wettest Australian state after Tasmania. Rainfall in Victoria increases from north to south, with higher averages in areas of high altitude. Median annual rainfall exceeds 1,800 mm (71 in) in some parts of the Northeast but is less than 250 mm (10 in) in the Mallee.
Rain is heaviest in the
Otway Ranges
on the southwest coast and
West Gippsland
in South-Central Victoria, and in the mountainous Northeast. Snow often falls on the low-lying hilly country in the centre of the state, and on rare occasions may also fall to sea level. Rain falls most frequently in winter, but summer precipitation is heavier. Rainfall is most reliable in Gippsland and the
Western District
, making them both leading farming areas. Victoria's highest recorded daily rainfall was 375 millimetres (14.8 in) at Tanybryn in the Otway Ranges on 22 March 1983.
[12]
 Labelled map showing the relative locations of the places mentioned in the table
| Place
|
Climate type
|
January max. temp
|
January min. temp
|
July max. temp
|
July min. temp
|
No. clear days
|
Annual precipitation
|
| Bairnsdale
[62]
|
Cfb
|
26 °C (79 °F)
|
13 °C (55 °F)
|
15 °C (59 °F)
|
4 °C (39 °F)
|
60
|
650 mm (26 in)
|
| Ballarat
[63]
|
Cfb
|
25 °C (77 °F)
|
11 °C (52 °F)
|
10 °C (50 °F)
|
3 °C (37 °F)
|
55
|
690 mm (27 in)
|
| Bendigo
[64]
|
Cfa
/
Cfb
|
30 °C (86 °F)
|
14 °C (57 °F)
|
12 °C (54 °F)
|
3 °C (37 °F)
|
110
|
514 mm (20 in)
|
| Falls Creek
[65]
|
Cfc
|
18 °C (64 °F)
|
9 °C (48 °F)
|
1 °C (34 °F)
|
?3 °C (27 °F)
|
N/A
|
1,274 mm (50 in)
|
| Geelong
[66]
|
Cfb
|
25 °C (77 °F)
|
13 °C (55 °F)
|
14 °C (57 °F)
|
5 °C (41 °F)
|
38
[67]
|
524 mm (21 in)
|
| Melbourne
[68]
(capital)
|
Cfb
|
26 °C (79 °F)
|
14 °C (57 °F)
|
14 °C (57 °F)
|
6 °C (43 °F)
|
49
|
648 mm (26 in)
|
| Mildura
[69]
|
BSk
|
32 °C (90 °F)
|
17 °C (63 °F)
|
15 °C (59 °F)
|
4 °C (39 °F)
|
132
|
291 mm (11 in)
|
| Portland
[70]
|
Csb
/
Cfb
|
22 °C (72 °F)
|
12 °C (54 °F)
|
13 °C (55 °F)
|
6 °C (43 °F)
|
40
|
840 mm (33 in)
|
| Shepparton
[71]
|
BSk
|
32 °C (90 °F)
|
15 °C (59 °F)
|
13 °C (55 °F)
|
3 °C (37 °F)
|
N/A
|
452 mm (18 in)
|
| Warrnambool
[72]
|
Cfb
|
22 °C (72 °F)
|
13 °C (55 °F)
|
13 °C (55 °F)
|
6 °C (43 °F)
|
53
|
743 mm (29 in)
|
Temperature and precipitation for Victoria.
Source: BOM ? Department of Primary Industries, Australian Natural Resources Atlas
-
Average January temperatures: Victoria's north is always hotter than coastal and mountainous areas.
-
Average July temperatures: Victoria's hills and ranges are coolest during winter. Snow also falls there.
-
Average yearly precipitation: Victoria's rainfall is concentrated in the mountainous north-east and coast.
-
Koppen map of Victoria
Western Australia
 Koppen map of Western Australia
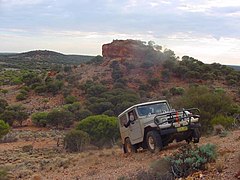 A four-wheel drive in the
Gibson Desert
A four-wheel drive in the
Gibson Desert
Most of Western Australia has a hot arid and semi-arid climate. However, the
south-west corner of the state
has a
Mediterranean climate
.
[73]
The area was originally heavily forested, including large stands of the
karri
, one of the world's
tallest trees
. This agricultural region of Western Australia is in the top nine terrestrial habitats for terrestrial
biodiversity
, with a higher proportion of
endemic species
than most other equivalent regions. Due to the offshore
Leeuwin Current
, the area numbers in the top six regions for
marine biodiversity
, containing the most southerly
coral reefs
in the world.
Average annual rainfall varies from 300 mm (12 in) at the edge of the
Wheatbelt
region to 1,400 mm (55 in) in the wettest areas near
Northcliffe
, the southwesternmost tip of Australia, but in the months of November to March, although rain still falls, evaporation exceeds rainfall and it is generally very dry. Plants must be adapted to this as well as the extreme poverty of all soils. A major reduction in rainfall has been observed, with a greater number of rainfall events in the summer months. The central four-fifths of the state is semi-arid or desert and is lightly inhabited with the only significant activity being mining. Annual rainfall averages about 200 to 250 mm (8 to 10 in), most of which occurs in sporadic torrential falls related to cyclone events in summer months.
An exception to this is the northern tropical regions. The
Kimberley
has an extremely hot monsoonal climate with average annual rainfall ranging from 500 to 1,500 mm (20 to 59 in), but there is a very long dry season of 7 months from April to November. Eighty-five per cent of the state's
runoff
occurs in the Kimberley, but because it occurs in violent floods and because of the insurmountable poverty of the generally shallow soils, development has only taken place along the
Ord River
.
 A
chaparral
-like bush land in the Mediterranean region of the state
A
chaparral
-like bush land in the Mediterranean region of the state
Australia's tropical/subtropical location and cold waters off the western coast make most of
Western Australia
a hot desert with aridity a marked feature of a greater part of the continent. These cold waters produce precious little moisture needed on the mainland. A 2005 study by Australian and American researchers
[74]
investigated the desertification of the interior, and suggested that one explanation was related to human settlers who
arrived about 50,000 years ago
.
Snowfall in the state is rare, and typically only in the
Stirling Range
near
Albany, the southwesternmost point in WA
, the only mountain range far enough south and with sufficient elevation. More rarely, snow can fall on the nearby
Porongurup Range
. Snow outside these areas is a major event; it usually occurs in hilly areas of south-western Australia. The most widespread low-level snow occurred on 26 June 1956 when snow was reported in the
Perth Hills
, as far north as
Wongan Hills
and as far east as
Salmon Gums
. However, even in the Stirling Range, snowfalls rarely exceed 5 cm (2 in) and rarely settle for more than one day.
[75]
The highest observed maximum temperature of 50.7 °C (123.3 °F) was recorded at
Onslow
on 13 January 2022. The lowest minimum temperature recorded was ?7.2 °C (19.0 °F) at
Eyre Bird Observatory
on 17 August 2008.
[12]
 Map of Western Australia with the places listed in the table labelled
| Place
|
Climate type
|
January max. temp
|
January min. temp
|
July max. temp
|
July min. temp
|
No. clear days
|
Annual precipitation
|
| Albany
[76]
|
Csb
|
23 °C (73 °F)
|
15 °C (59 °F)
|
16 °C (61 °F)
|
8 °C (46 °F)
|
45
|
929 mm (37 in)
|
| Broome
[77]
|
BSh
|
33 °C (91 °F)
|
26 °C (79 °F)
|
29 °C (84 °F)
|
14 °C (57 °F)
|
182
|
613 mm (24 in)
|
| Eucla
[78]
|
BSk
|
26 °C (79 °F)
|
17 °C (63 °F)
|
18 °C (64 °F)
|
7 °C (45 °F)
|
94
|
274 mm (11 in)
|
| Geraldton
[79]
|
Csa
/
BSh
|
32 °C (90 °F)
|
18 °C (64 °F)
|
19 °C (66 °F)
|
9 °C (48 °F)
|
164
|
441 mm (17 in)
|
| Kalgoorlie
[80]
|
BSk
|
34 °C (93 °F)
|
18 °C (64 °F)
|
17 °C (63 °F)
|
5 °C (41 °F)
|
151
|
266 mm (10 in)
|
| Karratha
[81]
|
BSh
|
36 °C (97 °F)
|
27 °C (81 °F)
|
26 °C (79 °F)
|
14 °C (57 °F)
|
158
|
297 mm (12 in)
|
| Perth
[82]
(capital)
|
Csa
|
30 °C (86 °F)
|
18 °C (64 °F)
|
17 °C (63 °F)
|
9 °C (48 °F)
|
131
|
868 mm (34 in)
|
| Wyndham
[83]
|
BSh
|
37 °C (99 °F)
|
26 °C (79 °F)
|
31 °C (88 °F)
|
17 °C (63 °F)
|
176
|
824 mm (32 in)
|
Distant Australian islands
Precipitation
Australia sits south of the
equator
and under a strong, migrating zone of high-pressure called the
subtropical ridge
; this can lead to some interesting cloud cover. Using an advanced supercomputer climate model called GEOS-5,
NASA
scientists recreated 19 days of changing cloud cover over Australia. Watch the visualisation to explore the movement of different systems that formed across the continent. Look for rising
cumulus clouds
that appear to bubble up over land each day.
 When the
Roaring forties
contract towards southeastern Australia, they would usually bring rainfall and as well as snow in the southeast, particularly around the
Australian Alps
.
[90]
When the
Roaring forties
contract towards southeastern Australia, they would usually bring rainfall and as well as snow in the southeast, particularly around the
Australian Alps
.
[90]
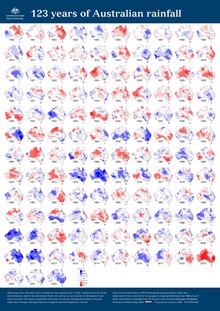 123 years of rainfall in Australia (1900-2022), report by
Bureau of Meteorology
.
123 years of rainfall in Australia (1900-2022), report by
Bureau of Meteorology
.
Rain
More than 80% of Australia has an annual rainfall of less than 600 mm (24 in); among the continents, only Antarctica receives less rainfall.
[91]
A place inland near
Lake Eyre
(in
South Australia
) would only receive 81 mm (3 in) of rain annually.
[92]
Another place, Troudaninna Bore (
29°11′44″S
138°59′28″E
/
29.19556°S 138.99111°E
/
-29.19556; 138.99111
, altitude : 46 m) in
South Australia
, from 1893 to 1936, received, in average, 104.9 mm (4.13 inches) of precipitation.
[93]
From one extreme to another, parts of the far
North Queensland
coast annually average over 4,000 mm (157 in), with the Australian annual record being 12,461 mm (491 in), set at the summit of
Mount Bellenden Ker
in 2000. Four factors contribute to the dryness of the Australian landmass:
- Cold ocean currents off the west coast
- Low elevation of landforms
- Dominance of high-pressure systems
- Shape of the landmass
The average annual rainfall in the
Australian desert
is low, ranging from 81 to 250 mm (3 to 10 in).
Thunderstorms
are relatively common in the region, with an annual average of 15 to 20 thunderstorms.
[94]
Summer daytime temperatures range from 32 to 40 °C (90 to 104 °F); winter temperatures run 18 to 23 °C (64 to 73 °F).
The southern parts of Australia get the usual
westerly
winds and rain-bearing
cold fronts
that come when high?pressure systems move towards northern Australia during winter. Cold snaps may bring frosts inland, though temperatures near the coast are mild or near mild all year round. The
Australian northwest cloudbands
provides up to 80% of the annual rainfall for northwestern Australia and up to 40% of the annual rainfall for southwestern Australia, including most of the winter rainfall over northwest
Western Australia
and
Central Australia
.
[95]
[96]
Summers in southern Australia are generally dry and hot with coastal
sea breezes
. During a lengthy dry spell, hot and dry winds from the interior can cause bushfires in some southern and eastern states, though most commonly
Victoria
and
New South Wales
.
The tropical areas of northern Australia have a wet summer because of the monsoon. During "the wet", typically October to April, humid north-westerly winds bring showers and thunderstorms. Occasionally,
tropical cyclones
can bring heavy rainfall to tropical coastal regions, which is also likely to reach further inland. After the monsoonal season, the dry season comes ("winter"), which brings mostly clear skies and milder conditions.
Rainfall records tend to be concentrated along the east coast of Australia, particularly in tropical north Queensland. The highest 24?hour rainfall on record in Australia was 907.0 millimetres (35.7 in) in
Crohamhurst
on 3 February 1893.
[97]
The highest monthly rainfall on record was 5,387.0 millimetres (212.1 in) recorded at
Mount Bellenden Ker
, Queensland in January 1979.
[97]
The highest annual rainfall was 12,461.0 millimetres (490.6 in) recorded also at Mount Bellenden Ker in 2000.
[97]
Additionally, the location which receives the highest average annual rainfall in Australia is
Babinda
in Queensland with an annual average of 4,279.4 millimetres (168.5 in).
[98]
Cold ocean currents off the coast of Western Australia result in little
evaporation
occurring. Hence, rain clouds are sparsely formed and rarely do they form long enough for a continuous period of rain to be recorded. Australia's arid/semi-arid zone extends to this region. The absence of any significant mountain range or area of substantial height above sea level, results in very little rainfall caused by
orographic uplift
. In the east the
Great Dividing Range
limits rain moving into inland Australia.
Australia has a compact shape, and no significant
bodies of water
penetrate very far inland. This is important in as much as moist winds are prevented from penetrating inland, so keeping rainfall low.
[99]
Snow
 Kanangra-Boyd National Park
in the
Blue Mountains
region of
New South Wales
in southeastern Australia after a snowfall event.
Kanangra-Boyd National Park
in the
Blue Mountains
region of
New South Wales
in southeastern Australia after a snowfall event.
In Australia, snow falls frequently on the highlands of the southeast, in the states of
Victoria
,
New South Wales
and
Tasmania
and in the
Australian Capital Territory
. There is a regular snow season in several areas which have seasonal
ski tourism
industries, such as
Thredbo
,
Cabramurra
,
Mount Buller
and
Perisher Ski Resort
, among others. Snow falls with some regularity above 900 metres (3,000 ft) on the
Great Dividing Range
, seldom as far north as
Stanthorpe
in southernmost Queensland and in isolated parts of
South Australia
and
Western Australia
, but outside these areas, snow is an extremely rare occurrence. Snow has also fallen on
Uluru
and near
Alice Springs
on at least one occasion.
Snow at sea level is occasionally recorded on mainland Australia (namely in southwestern and south-central Victoria), but is more frequent in western Tasmania where snowfalls at sea level can occur nigh to annually during the winter months; and in the extreme event of November 2021, snow was recorded to sea level on
Bruny Island
. Snow has been recorded across most of Tasmania, though it is rare on the eastern coast at sea level due to being
leeward
of the snow-bearing westerlies. Snow is rare in the southernmost capitals like
Melbourne
and
Hobart
, falling less than once every decade, and in the other capitals it is unknown (however snow has fallen in the hill suburbs of
Perth
and
Adelaide
). There are extensive, well-developed
ski fields
in the Great Dividing Range, a few hours' drive from Melbourne and
Sydney
.
Light snow generally falls once every few winters in Canberra and somewhat more regularly in the cities of
Orange
and
Ballarat
. However, there are many smaller towns that receive more regular seasonal snowfalls, such as
Oberon
,
Crookwell
,
Cooma
,
Jindabyne
,
Batlow
,
Bombala
and
Omeo
. West of the Great Dividing Range, particularly in the
South West Slopes
, snow is observed more frequently and to much lower altitudes than on the eastern side (even
Parkes
,
Forbes
and
Wagga Wagga
have recorded snow); the lowest recorded snowfall in New South Wales fell to an altitude of just 165 metres (541 ft) in
Albury
, most recently in July 1966. The snowiest proper towns in Australia are
Trentham
in west central Victoria, averaging 7.8 days per annum on which snow falls; and
Nimmitabel
in southern New South Wales, averaging 8.0 snowy days.
[100]
[101]
The isolated East Gippsland locality of
Bendoc
averages 14.7 snowy days per annum, while
Aberfeldy
in West Gippsland averages an impressive 32.5 snowy days per annum.
[102]
The occasional cold snap, caused by cold air drifting north from Antarctica, can cause significant snowfall in rural areas, as well as major cities such as Hobart, Melbourne's outer mountain suburbs and
Canberra
. Such occasions are rare, but have occurred in 1958, 1965, 1986, 2005 and 2015, the 1965 event causing snow to fall as far north as
Eungella
, near
Mackay
in
tropical Queensland
.
[103]
Extreme snow events have also produced snow as far north-west as
Longreach
in Queensland and in the ranges near
Alice Springs
, and also in lowland areas such as
Dubbo
and
Gunnedah
in northern New South Wales. The frequency and intensity of such events have been decreasing significantly over the past 40 years and the most northerly occurrence of snow in this time frame has been the
Bunya Mountains
in southern Queensland.
[104]
Temperatures
 A
billabong
in the
Kakadu National Park
,
Northern Territory
. The monsoon climate of northern Australia is hot and humid in summer.
A
billabong
in the
Kakadu National Park
,
Northern Territory
. The monsoon climate of northern Australia is hot and humid in summer.
The tropical
savannah
zone of Northern Australia is warm to hot all year. Summers are hot in most of the country with average January maximum temperatures exceeding 30 °C over most of the mainland, except for high elevations. Winters are warm in the north and cool in the south, with nightly frosts common in inland areas south of the
Tropic of Capricorn
. Only at the highly elevated areas do wintertime temperatures approach those found in much of Europe or North America, especially the southern parts.
Temperatures in Australia have followed an
increasing trend
between the years of 1910 and 2004 by approximately 0.7 °C. Overnight minimum temperatures have warmed more rapidly than daytime maximum temperatures. The observed warming has hastened in recent years. The late-20th-century warming has been largely attributed to the increased
greenhouse effect
.
[105]
Temperature differences between winter and summer are minor in the tropical region of Australia. However, they are greatest in the southern inland, with seasonal differences along the coast being moderated by the ocean's proximity. In July, a more common latitudinal distribution of average maximums is apparent, ranging from 30 °C near the north coast to below 3 °C in the mountainous areas of the south-east.
[106]
Average minimum temperatures in all seasons are highest in northern Australia and near the coastal areas, and are lowest in the elevated areas of the south-east. The highest average January minimum temperatures (near 27 °C) are found near the
north-west coast
, while in winter they exceed 20 °C at some coastal locations in northern Australia and on the
Torres Strait
and
Tiwi Islands
. In the mountains of New South Wales, it is not unusual to have average low minimum temperatures dipping below 5 °C in January and ?5 °C in July. Comparatively, most inland (non-mountainous) areas south of the tropics have average July minimum between 0 and 6 °C.
In the desert, the dry air and clear skies give rather large ranges in temperature between day and night. Ranges of 15 °C being typical and 20 °C not quite unusual. Light nighttime
frosts
in winter occur over much of the southern half of the arid zone, where mean July minimum temperatures are mostly in the 3 to 6 °C range. Moving north, frosts become increasingly rare, with mean July minimum being around 10 °C on the northern boundary.
The highest maximums in Australia are recorded in two regions, the
Pilbara
and
Gascoyne
regions of north-western Western Australia and the area extending from south-western
Queensland
across South Australia into south-eastern
Western Australia
. Many locations in this region have recorded temperatures exceeding 48 °C. In January, average maximum temperatures exceed 35 °C over a large area of the interior and exceed 40 °C over areas in the north-west. The highest summer maximums in the Pilbara and Gascoyne average at around 41 °C (in some years daily maximums consecutively exceed 40 °C for several weeks at a time).
Extremes
The most powerful
heatwave
in the history of south-eastern Australia occurred in January 1939. Adelaide (46.1 °C on the 12th), Melbourne (45.6 °C on the 13th) and Sydney (45.3 °C on the 14th) all had record-high temperatures during this period, as did many other central district areas in New South Wales, Victoria and South Australia. The record number of consecutive days in
Melbourne
over 40 °C is five, with
Brisbane
having two and
Sydney
having four. Heatwaves usually bring by oppressively warm nights, with
Oodnadatta
, SA recording an Australian record of nine nights above 30 °C in February 2004.
[107]
Another extreme event was a prolonged period of extensive heatwaves known as the
Angry Summer
in early 2013.
Marble Bar
achieved 160 consecutive days above 37.8 °C (100.0 °F) in 1923?24.
Nyang
had an average maximum of 44.8 °C for the months of February 1998 and January 2005, an Australian record. At the other extreme, average January maximums are near 15 °C on the highest peaks of the south-east ranges and near 20 °C in much of
Tasmania
. In most of the desert region during summer, cool days are rare and usually associated with major rain events?a rather exceptional example occurred in February 1949, when many areas failed to reach 20 °C on one or more days, and the maximum at
Boulia
,
western Queensland
was at 14.4 °C, which was 23 °C below normal.
Many other locations in Australia, except those above 500 metres, have extreme maximums between 43 and 48 °C. Most Tasmanian sites away from the north coast have had extreme maximums between 35 and 40 °C. The lowest extreme maximums are found along the north coast of Tasmania (e.g. 29.5 °C at
Low Head
) and at high elevations (27.0 °C at
Thredbo
). While extreme high temperatures are more common inland than they are near the coast, notable extreme maxima have been observed near the coast; 50.7 °C at
Onslow
, 50.5 °C at
Mardie
, 49.9 °C at
Nullarbor, South Australia
, 49.8 °C at
Eucla, South Australia
and 49.5 °C at
Port Augusta, South Australia
.
[108]
At lower elevations, most inland places south of the tropics have extreme minimum between ?3 and ?7 °C, and these low temperatures have also occurred in locations within a few kilometres of southern and eastern coasts, such as
Sale, Victoria
(?5.6 °C),
Bega, New South Wales
(?8.1 °C),
Grove, Tasmania
(?7.5 °C) and
Taree
, New South Wales (?5.0 °C). Many locations in this region have recorded ?10 °C or lower, including Gudgenby in the Australian Capital Territory (?14.6 °C) and
Woolbrook, New South Wales
(?14.5 °C). In the desert, the lowest extreme minimum occur at high elevations, especially around
Alice Springs
, where the temperature has fallen as low as ?7.5 °C.
In the tropics, extreme minimum near or below 0 °C have occurred at many places distant from the coast, as far north as
Herberton, Queensland
(?5.0 °C). Some locations near tropical coasts, such as
Mackay
(?0.8 °C),
Townsville
(0.1 °C) and
Kalumburu, Western Australia
(0.3 °C) have also recorded temperatures near 0 °C. In contrast, some coastal locations, such as
Darwin
, have never fallen below 10 °C, and
Thursday Island
, in the Torres Strait, has an extreme minimum of 16.1 °C. The lowest maximum temperature on record in Australia was ?6.9 °C (19.6 °F), recorded on 9 July 1978 at Thredbo Ski Resort in New South Wales.
[109]
The highest minimum temperature on record was 36.6 °C (97.9 °F) on 26 January 2019 at
Borrona Downs Station
near
Wanaaring
, New South Wales. Before this heatwave, the previous record was 35.5 °C (95.9 °F), recorded on 24 January 1982 in
Arkaroola
, South Australia and again on 21 January 2003 in
Wittenoom, Western Australia
.
[110]
A list of extremes can be found in the tables below:
| Absolute temperature ranges
|
| Month
|
Maximum temperatures
|
Minimum temperatures
|
| °C
|
°F
|
location and date
|
°C
|
°F
|
location and date
|
| January
|
50.7
|
123.3
|
Oodnadatta
, South Australia (2 January 1960)
[111]
Onslow
, Western Australia (13 January 2022)
[112]
|
?7.7
|
18.1
|
Thredbo Ski Resort
, New South Wales (24 January 2000)
[113]
|
| February
|
50.5
|
122.9
|
Mardie
, Western Australia (19 February 1998)
[114]
|
?7.0
|
19.4
|
Perisher Ski Resort
, New South Wales (17 February 1979)
[115]
|
| March
|
48.5
|
119.3
|
Emu Creek Station
, Western Australia (11 March 2019)
[116]
|
?7.2
|
19.0
|
Kiandra
, New South Wales (25 March 1964)/
Bullocks Flat
, New South Wales (31 March 1988)
[117]
|
| April
|
45.0
|
113.0
|
Port Hedland
, Western Australia (1 April 1948)/
Marble Bar
, Western Australia (2 April 1928)
[118]
|
?13.0
|
8.6
|
Charlotte Pass
, New South Wales (29 April 2009)
[115]
|
| May
|
40.6
|
105.1
|
Bidyadanga
, Western Australia (6 May 1990)
[119]
|
?13.4
|
7.9
|
Charlotte Pass, New South Wales (24 May 2008)
[120]
|
| June
|
37.8
|
100.0
|
Wyndham
, Western Australia (2 June 1962)
[121]
|
?23.0
|
?9.4
|
Charlotte Pass, New South Wales (29 June 1994)
[122]
|
| July
|
37.6
|
99.7
|
Wyndham, Western Australia (19 July 1996)
[123]
|
?19.6
|
?3.3
|
Charlotte Pass, New South Wales (20 July 2010)
[124]
|
| August
|
41.2
|
106.2
|
West Roebuck
, Western Australia (23 August 2020)
[125]
|
?20.6
|
?5.1
|
Charlotte Pass, New South Wales (14 August 1968)
[126]
|
| September
|
43.1
|
109.6
|
West Roebuck
, Western Australia (27 September 2003)
[125]
|
?16.7
|
1.9
|
Charlotte Pass, New South Wales (20 September 1967)
[127]
|
| October
|
46.9
|
116.4
|
Port Hedland, Western Australia (22 October 2002)
[128]
|
?12.0
|
10.4
|
Charlotte Pass, New South Wales (29 October 2006)
[129]
|
| November
|
48.7
|
119.7
|
Birdsville
, Queensland (17 November 1990)
[130]
|
?9.4
|
15.1
|
Charlotte Pass, New South Wales (26 November 1968)
[131]
|
| December
|
49.9
|
121.8
|
Nullarbor
, South Australia (19 December 2019)
[132]
|
?9.0
|
15.8
|
Thredbo Ski Resort, New South Wales (13 December 1976)
[133]
|
| Climate data for Australia
|
| Month
|
Jan
|
Feb
|
Mar
|
Apr
|
May
|
Jun
|
Jul
|
Aug
|
Sep
|
Oct
|
Nov
|
Dec
|
Year
|
| Record high °C (°F)
|
50.7
(123.3)
|
50.5
(122.9)
|
48.1
(118.6)
|
45.0
(113.0)
|
40.6
(105.1)
|
37.8
(100.0)
|
37.6
(99.7)
|
41.2
(106.2)
|
43.1
(109.6)
|
46.9
(116.4)
|
48.7
(119.7)
|
49.9
(121.8)
|
50.7
(123.3)
|
| Record low °C (°F)
|
?7.7
(18.1)
|
?7.0
(19.4)
|
?7.2
(19.0)
|
?13.0
(8.6)
|
?13.4
(7.9)
|
?23.0
(?9.4)
|
?19.6
(?3.3)
|
?20.6
(?5.1)
|
?16.7
(1.9)
|
?12.0
(10.4)
|
?9.4
(15.1)
|
?9.0
(15.8)
|
?23.0
(?9.4)
|
| Source: Bureau of Meteorology, Australian Government
[134]
|
Natural hazards and disasters
Bushfires
Climatic factors contribute to Australia's high incidence of bushfires, particularly during the summer months. Low
relative humidity
, wind and lack of rain can cause a small fire, either man-made or caused by
lightning strikes
, to spread rapidly. Low humidity, the heat of the sun and lack of water cause vegetation to dry out becoming a perfect fuel for the fire. High winds fan the flames, increasing their intensity and the speed and distance at which they can travel.
[135]
Many of the worst bushfires in eastern Australia, such as the 1983
Ash Wednesday fires
, accompany
El Nino?Southern Oscillation
events which tend to cause a warm, dry and windy climate.
[136]
The worst bushfires in Australian history occurred during the
2019?2020 Australian bushfire season
, also known as the "Black Summer", which lasted for 6 months and burnt 140,000 km
2
(55,000 mi
2
) of land primarily in New South Wales, Victoria, Queensland and the Australian Capital Territory. By the end of the season there had been 14-34 direct human deaths, hundreds of indirect human deaths, 1-3 billion animal deaths and 3,500 homes destroyed.
[137]
[138]
Prior to this, the worst had been the
Black Saturday fires
in February to March 2009, causing 173 deaths and destroying over 2000 homes in Victoria.
[139]
Dust storms
A dust storm or sandstorm, a meteorological phenomenon common in arid and semi-arid regions, arises when a gust front passes or when the wind force exceeds the threshold value where loose sand and
dust
are removed from the dry surface. Particles are transported by
saltation
and suspension, causing soil
erosion
from one place and
deposition
in another.
Sandstorm
usually refers to dust storms in desert areas when, in addition to fine particles obscuring visibility, a considerable amount of larger sand particles moves closer to the surface. The term
dust storm
is more likely to be used when finer particles are blown long distances, especially when the dust storm affects urban areas.
Drought
 Drought-affected paddock in the New South Wales farming region of the
Riverina
Drought-affected paddock in the New South Wales farming region of the
Riverina
Drought in Australia is defined by rainfall over a three-month period being in the lowest ten per cent of amounts having been recorded for that region in the past.
[140]
This definition takes into account that low rainfall is a relative term and rainfall deficiencies need to be compared to typical rainfall patterns including seasonal variations. Specifically drought in Australia is defined in relation to a rainfall deficiency of
pastoral leases
and is determined by decile analysis applied to a certain area.
[141]
Historical climatic records are now sufficiently reliable to profile climate variability taking into account expectations for regions.
[142]
State Governments
are responsible for declaring a region drought affected and the declaration will take into account factors other than rainfall.
[140]
Flooding
Though most of Australia is arid or semi-arid, some regions have very significant rainfall. The
Wet Tropics
in northeast Queensland as well as the western half of
Tasmania
both average over 1400mm (55 in) of rainfall annually, sometimes much higher. As a result, the former has some of Australia's only
tropical rainforest
, while the latter features extensive
temperate rainforests
where floods can occur at any time.
Through
La Nina
years the eastern seaboard of Australia (east of the
Great Dividing Range
) records above-average rainfall, usually creating damaging floods. The 2010?2011 La Nina system broke many rainfall records in Australia, particularly in the states of Queensland and New South Wales, with extensive flooding and major damage to infrastructure and crops. The central east area of Queensland, an area the size of Germany and France combined, was
under water in 2010?11
. La Nina related flooding has affected major eastern cities such as Sydney, and especially Brisbane. The
2022 eastern Australia floods
were also one of the worst recorded flood events.
West of the Great Dividing Range, higher than average rainfall may be related to a negative
Indian Ocean Dipole
, which sometimes leads to inland flooding, particularly in the
Murray-Darling Basin
river system and its flood plains and especially during winter.
The
Top End
,
Kimberley
and much of
North
and
Far North Queensland
are affected by the Australian monsoon (wet season) which brings heavy rain, thunderstorms, tropical cyclones (see below) and frequent flooding from November to April, making many unsealed roads impassable for part of the year. As a result, these regions are feature extensive tropical savannah.
Snowfall
Blizzards
are not common in mainland Australia, but occur frequently in the Snowy Mountains in New South Wales and Victoria. When blizzards do occur, they can affect the Tasmanian Highlands and, particularly,
Mount Wellington
, which towers over the Tasmanian capital Hobart. Blizzards do not affect any major towns or cities, because there are no populated areas located in the mountains except for the ski resort towns of New South Wales and Victoria.
Tornadoes
In Australia, a tornado is also known as a twister or willy-willy. The earliest recorded tornado in Australia was in 1795. The country experiences about 60 tornadoes per year.
[143]
Tropical cyclones
 Cyclone Monica at peak intensity
Australia is affected by tropical cyclones which primarily occur between December and April but have occasionally developed in November and May.
[144]
Cyclones over mainland Australia occur on average five to six times each year.
[91]
The regions between
Broome
and
Exmouth
are most prone to cyclones.
[145]
Tropical cyclones are known to bring destructive winds, heavy rain with flooding creating storm surges along the coast, causing inundation to low-lying areas. The strongest Australian region cyclone was 2006's
Cyclone Monica
, with gusts topping 350 km/h (220 mph). Cyclones can also move inland, decaying to rain depressions, dumping heavy rain and causing flooding.
[146]
The worst cyclones of Australia have caused billions of dollars of damage and many deaths.
Cyclone Tracy
crossed directly over Darwin in 1974, killing 71 persons. It was Australia's most damaging cyclone.
[147]
Cyclone Mahina
in 1899 brought a
storm surge
to
Far North Queensland
reaching 13 metres (43 ft) high, causing 400 deaths and making it the worst natural disaster to befall Australia.
[148]
Cyclone Larry
struck North Queensland and passed over
Innisfail
in 2006 causing damages estimated at A$1.5 billion. However, there were no deaths in that storm.
Cyclone Yasi
caused severe flooding and had a total estimated cost of A$3.5 billion making it the second-most costliest cyclone to strike Australia.
[147]
Climate change
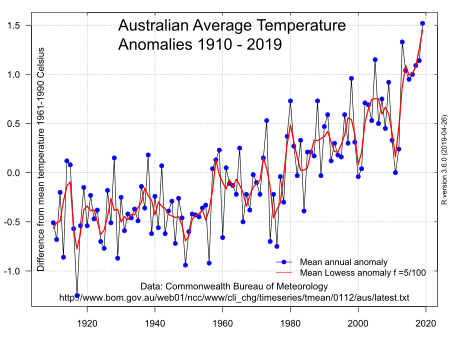 Australian annual average temperature anomaly from 1910 to 2019 with five-year
locally weighted ('lowess')
trend line. Source: Australian BOM.
Australian annual average temperature anomaly from 1910 to 2019 with five-year
locally weighted ('lowess')
trend line. Source: Australian BOM.
 Climate change is increasing the frequency and size of bushfires, as evidenced by the
2019?20 Australian bushfire season
.
[149]
Climate change is increasing the frequency and size of bushfires, as evidenced by the
2019?20 Australian bushfire season
.
[149]
Climate change
has been a critical issue in
Australia
since the beginning of the 21st century. Australia is becoming hotter and more prone to extreme heat,
bushfires
, droughts, floods, and longer fire seasons because of climate change. Climate issues include
wildfires
,
heatwaves
,
cyclones
,
rising sea levels
, and
erosion
.
[150]
[151]
[152]
Since the beginning of the 20th century, Australia has experienced an increase of over 1.4 °C in average annual temperatures,
[153]
with warming occurring at twice the rate over the past 50 years compared with the previous 50 years.
[154]
Recent climate events such as extremely high temperatures and widespread drought have focused government and public attention on the effects of
climate change in Australia
.
[155]
Rainfall in
southwestern Australia
has decreased by 10?20% since the 1970s, while southeastern Australia has also experienced a moderate decline since the 1990s. Rainfall is expected to become heavier and more infrequent, as well as more common in summer rather than in winter. Australia's annual average temperatures are projected to increase 0.4?2.0 °C above 1990 levels by the year 2030, and 1?6 °C by 2070. Average precipitation in the southwest and southeast Australia is projected to decline during this time, while regions such as the northwest may experience increases in rainfall.
Climate change is
affecting
the continent's environment and ecosystems. Australia is vulnerable to the effects of global warming projected for the next 50 to 100 years because of its extensive arid and semi-arid areas, and already warm climate, high annual rainfall variability. The continent's high fire risk increases this susceptibility to changes in temperature and climate. Meanwhile, Australia's coastlines will experience erosion and inundation from an estimated 8?88 cm increase in global sea level. Australia's unique ecosystems such as the
Great Barrier Reef
and many
animal species
are also at risk.
Climate change also has diverse implications for Australia's economy,
agriculture
and public health.
[156]
Projected impacts include more severe
floods
,
droughts
, and cyclones.
[157]
Furthermore, Australia's population is highly concentrated in coastal areas at risk from rising sea levels, and existing pressures on
water supply
will be exacerbated. The exposure of
Indigenous Australians
to climate change impacts is exacerbated by existing socio-economic disadvantages which are linked to colonial and post-colonial marginalisation.
[150]
The communities most affected by climate changes are those in the North where
Aboriginal
and
Torres Strait Islander
people make up 30% of the population.
[158]
Aboriginal and Torres Strait Islander communities located in the coastal north are the most disadvantaged due to social and economic issues and their reliance on traditional land for food, culture, and health. This has raised the question for many community members in these areas, "Should we stay or move away?"
[158]
Australia is also a contributor to climate change, with its
greenhouse gas emissions
per capita above the world average. The country is highly reliant on
coal
and other
fossil fuels
, although
renewable energy
coverage is increasing.
[159]
National
mitigation
efforts include a commitment to achieving
net zero
emissions by 2050 under the
Paris Agreement
, although Australia has repeatedly ranked poorly in the
Climate Change Performance Index
and other international rankings for its climate targets and implementation.
Adaptation
can be performed at national and local levels
[160]
and was identified as a priority for Australia in the 2007
Garnaut Review
.
Climate change has been a
divisive or politicised issue
in
Australian politics
since the 2000s, contributing to successive governments implementing and repealing mitigation policies such as
carbon pricing
. Some
Australian media outlets
have promoted
climate misinformation
. The issue has sparked
protests
in support of climate change policies, including some of the largest demonstrations in Australia's history.
See also
References
- ^
Scientists Trace Extreme Heat in Australia to Climate Change
Archived
4 October 2019 at the
Wayback Machine
29 September 2014 NYT
- ^
"State of the Climate 2014"
.
Bureau of Meteorology
.
Archived
from the original on 12 January 2020
. Retrieved
29 March
2014
.
- ^
"CSIRO report says Australia getting hotter with more to come"
.
ABC Online
. 4 March 2014.
Archived
from the original on 16 May 2019
. Retrieved
20 April
2014
.
- ^
"
"Stats" (Australian Government)"
.
Archived
from the original on 30 April 2019
. Retrieved
19 May
2013
.
- ^
Climate of Australia
- ^
Precipitation in Australia
. Routledge. 1997. p. 376.
ISBN
978-0-415-12519-2
.
Archived
from the original on 12 September 2023
. Retrieved
14 June
2015
.
- ^
"Canberra: Climate and water"
.
bom.gov.au
.
Archived
from the original on 13 August 2020
. Retrieved
11 February
2020
.
- ^
Territory, Bureau of Meteorology Australian Capital (3 January 2020).
"Untitled"
.
@BOM_ACT
.
Archived
from the original on 18 January 2020
. Retrieved
4 January
2020
.
Canberra has reached 43.6C?a new hottest temperature record for any month. The previous Canberra records are 42.2C at Canberra Airport in 1968 and 42.8C at the now-closed Acton site in 1939.
- ^
Australian Bureau of Statistics
,
2002 Yearbook of Australia
Archived
12 October 2012 at the
Wayback Machine
. Retrieved 22 July 2007.
- ^
Southerly Busters Explained
Archived
17 August 2013 at the
Wayback Machine
. The Australian Government Bureau of Meteorology. Retrieved 21 February 2012.
- ^
Jason J. Sharples, Graham A. Mills, Richard H. D. McRae, and Rodney O. Weber.
"Foehn-Like Winds and Elevated Fire Danger Conditions in Southeastern Australia"
.
Journal of Applied Meteorology and Climatology
. American Meteorological Society.
Archived
from the original on 8 October 2021
. Retrieved
8 October
2021
.
{{
cite news
}}
: CS1 maint: multiple names: authors list (
link
)
- ^
a
b
c
d
e
f
g
h
"Rainfall and Temperature Records: National"
(PDF)
. Bureau of Meteorology (BOM).
Archived
(PDF)
from the original on 10 November 2010
. Retrieved
17 November
2009
.
- ^
"Climate statistics for Australian locations"
.
bom.gov.au
. Bureau of Meteorology.
Archived
from the original on 30 December 2018
. Retrieved
10 January
2020
.
- ^
"Climate statistics for Australian locations"
.
bom.gov.au
. Bureau of Meteorology.
Archived
from the original on 11 June 2011
. Retrieved
10 January
2020
.
- ^
"Armidale Climate Statistics"
. BOM.
Archived
from the original on 6 May 1999
. Retrieved
16 April
2009
.
- ^
"Broken Hill Airport Climate Statistics"
. BOM.
Archived
from the original on 31 August 2004
. Retrieved
16 April
2009
.
- ^
"Climate statistics for Australian locations"
.
bom.gov.au
.
Archived
from the original on 7 September 2015
. Retrieved
8 January
2020
.
- ^
"Coffs Harbour Climate Statistics"
. BOM.
Archived
from the original on 7 May 1999
. Retrieved
16 April
2009
.
- ^
"Orange Climate Statistics"
. BOM.
Archived
from the original on 6 April 2017
. Retrieved
10 January
2017
.
- ^
"Penrith Lakes Climate Statistics"
. BOM.
Archived
from the original on 15 June 2008
. Retrieved
16 April
2009
.
- ^
"Sydney (Observatory Hill) Climate Statistics"
. BOM.
Archived
from the original on 9 February 2020
. Retrieved
16 April
2009
.
- ^
"Wagga Wagga Climate Statistics"
. BOM.
Archived
from the original on 17 August 2000
. Retrieved
16 April
2009
.
- ^
"Wollongong Climate Statistics"
. BOM.
Archived
from the original on 29 November 2014
. Retrieved
16 April
2009
.
- ^
"Summary statistics Darwin Airport"
. BOM. 15 July 2009.
Archived
from the original on 30 January 1998
. Retrieved
26 July
2009
.
- ^
"Summary statistics Alice Springs Airport"
. BOM. 16 July 2009.
Archived
from the original on 2 June 2011
. Retrieved
26 July
2009
.
- ^
"CHAPTER 7: Introduction to the Atmosphere"
.
physicalgeography.net
.
Archived
from the original on 15 October 2019
. Retrieved
15 July
2008
.
- ^
BOM ? Climate of Queensland
- ^
BOM ? Australian climatic zones
[
permanent dead link
]
- ^
"Climate statistics for Australian locations"
.
bom.gov.au
.
Archived
from the original on 16 May 2018
. Retrieved
8 January
2020
.
- ^
"Brisbane Climate Statistics"
. BOM.
Archived
from the original on 17 October 2007
. Retrieved
5 January
2017
.
- ^
"Cairns Climate Statistics"
. BOM.
Archived
from the original on 11 January 2012
. Retrieved
5 January
2017
.
- ^
"Gold CoastClimate Statistics"
. BOM.
Archived
from the original on 1 February 2014
. Retrieved
5 January
2017
.
- ^
"Mackay Climate Statistics"
. BOM.
Archived
from the original on 4 March 2010
. Retrieved
5 January
2017
.
- ^
"Mt Isa Climate Statistics"
. BOM.
Archived
from the original on 6 January 2017
. Retrieved
5 January
2017
.
- ^
"Rockhampton Climate Statistics"
. BOM.
Archived
from the original on 10 May 2015
. Retrieved
5 January
2017
.
- ^
"Climate statistics for Australian locations"
.
bom.gov.au
.
Archived
from the original on 9 May 2015
. Retrieved
7 January
2020
.
- ^
"Toowoomba Climate Statistics"
. BOM.
Archived
from the original on 4 May 2009
. Retrieved
5 January
2017
.
- ^
"Townsville Climate Statistics"
. BOM.
Archived
from the original on 5 December 2016
. Retrieved
5 January
2017
.
- ^
"Climate statistics for Australian locations"
.
bom.gov.au
.
Archived
from the original on 10 May 2015
. Retrieved
8 January
2020
.
- ^
"Atlas of South Australia | Climate and Weather"
. Archived from
the original
on 15 March 2010
. Retrieved
6 December
2009
.
- ^
"Adelaide Climate Statistics"
. BOM.
Archived
from the original on 3 April 2007
. Retrieved
8 January
2017
.
- ^
"Climate statistics for Australian locations"
.
bom.gov.au
.
Archived
from the original on 7 October 2012
. Retrieved
8 January
2020
.
- ^
"Mount Gambier Climate Statistics"
. BOM.
Archived
from the original on 22 September 2008
. Retrieved
8 January
2017
.
- ^
"Oodnadatta Climate Statistics"
. BOM.
Archived
from the original on 18 November 2020
. Retrieved
5 January
2017
.
- ^
"Port Augusta Climate Statistics"
. BOM.
Archived
from the original on 9 January 2017
. Retrieved
8 January
2017
.
- ^
"Climate statistics for Australian locations"
.
bom.gov.au
.
Archived
from the original on 21 January 2018
. Retrieved
26 December
2019
.
- ^
"Whyalla Climate Statistics"
. BOM.
Archived
from the original on 16 September 2019
. Retrieved
8 January
2017
.
- ^
"Climate of Launceston"
.
BOM
. Archived from
the original
on 22 February 2009
. Retrieved
1 January
2009
.
- ^
McIntyre, Damian (7 August 2020).
"Liawenee in Tasmania's Central Highlands breaks record for coldest temperature in island state"
.
ABC News
.
Archived
from the original on 7 August 2020
. Retrieved
8 August
2020
.
- ^
"Climate statistics for Australian locations"
.
bom.gov.au
.
Archived
from the original on 4 March 2016
. Retrieved
8 January
2020
.
- ^
"Devonport Climate Statistics"
. BOM.
Archived
from the original on 30 November 2013
. Retrieved
8 January
2017
.
- ^
"Climate statistics for Australian locations"
.
bom.gov.au
.
Archived
from the original on 17 November 2015
. Retrieved
9 January
2020
.
- ^
"Hobart Climate Statistics"
. BOM.
Archived
from the original on 7 January 2019
. Retrieved
8 January
2017
.
- ^
"Climate statistics for Australian locations"
.
bom.gov.au
.
Archived
from the original on 10 June 2007
. Retrieved
8 January
2020
.
- ^
"Launceston Climate Statistics"
. BOM.
Archived
from the original on 9 January 2017
. Retrieved
8 January
2017
.
- ^
"Climate statistics for Australian locations"
.
bom.gov.au
.
Archived
from the original on 14 March 2014
. Retrieved
13 January
2020
.
- ^
"Climate statistics for Australian locations"
.
bom.gov.au
.
Archived
from the original on 9 July 2011
. Retrieved
7 January
2020
.
- ^
"Climate statistics for Australian locations"
.
bom.gov.au
.
Archived
from the original on 9 May 2015
. Retrieved
9 January
2020
.
- ^
"Strahan Climate Statistics"
. BOM.
Archived
from the original on 23 November 2004
. Retrieved
8 January
2017
.
- ^
Hopetoun sizzles as Mildura sweats
Archived
14 January 2012 at the
Wayback Machine
- ^
"City swelters, records tumble in heat"
.
The Age
. Melbourne. 7 February 2009.
Archived
from the original on 8 February 2009
. Retrieved
28 March
2011
.
- ^
"Bairnsdale Climate Statistics"
. BOM.
Archived
from the original on 30 October 2013
. Retrieved
17 January
2017
.
- ^
"Ballarat Climate Statistics"
. BOM.
Archived
from the original on 12 January 2011
. Retrieved
17 January
2017
.
- ^
"Bendigo Climate Statistics"
. BOM.
Archived
from the original on 25 March 2019
. Retrieved
17 January
2017
.
- ^
"Climate statistics for Australian locations"
.
bom.gov.au
.
Archived
from the original on 29 June 2009
. Retrieved
9 January
2020
.
- ^
"Climate statistics for Australian locations"
.
bom.gov.au
.
Archived
from the original on 4 June 2019
. Retrieved
8 January
2020
.
- ^
"Climate statistics for Australian locations"
.
bom.gov.au
.
Archived
from the original on 30 April 2009
. Retrieved
8 January
2020
.
- ^
"Melbourne Climate Statistics"
. BOM.
Archived
from the original on 31 October 2019
. Retrieved
17 January
2017
.
- ^
"Mildura Climate Statistics"
. BOM.
Archived
from the original on 1 November 2019
. Retrieved
17 January
2017
.
- ^
"Climate statistics for Australian locations"
.
bom.gov.au
.
Archived
from the original on 18 July 2012
. Retrieved
8 January
2020
.
- ^
"Shepparton Climate Statistics"
. BOM.
Archived
from the original on 25 March 2019
. Retrieved
17 January
2017
.
- ^
"Warrnambool Climate Statistics"
. BOM.
Archived
from the original on 18 January 2017
. Retrieved
17 January
2017
.
- ^
"Climate of Western Australia"
. BOM. Archived from
the original
on 17 March 2009
. Retrieved
6 December
2009
.
- ^
Miller G, Mangan J, Pollard D, Thompson S, Felzer B, et al. (2005)
Sensitivity of the Australian Monsoon to insolation and vegetation: Implications for human impact on continental moisture balance.
Archived
4 April 2006 at the
Wayback Machine
Geology: Vol. 33, No. 1 pp. 65?68
- ^
Snow in Western Australia: About Snow in WA
Archived
11 May 2011 at the
Wayback Machine
. Retrieved 4 February 2007.
- ^
"Albany Climate Statistics"
. BOM.
Archived
from the original on 2 November 2013
. Retrieved
10 January
2017
.
- ^
"Broome Climate Statistics"
. BOM.
Archived
from the original on 6 February 2009
. Retrieved
10 January
2017
.
- ^
"Climate statistics for Australian locations"
.
bom.gov.au
.
Archived
from the original on 30 January 1998
. Retrieved
9 January
2020
.
- ^
"Geraldton Climate Statistics"
. BOM.
Archived
from the original on 18 September 2019
. Retrieved
10 January
2017
.
- ^
"Kalgoorlie Climate Statistics"
. BOM.
Archived
from the original on 25 March 2019
. Retrieved
10 January
2017
.
- ^
"Karratha Climate Statistics"
. BOM.
Archived
from the original on 25 March 2012
. Retrieved
10 January
2017
.
- ^
"Perth Climate Statistics"
. BOM.
Archived
from the original on 28 May 2009
. Retrieved
10 January
2017
.
- ^
"Climate statistics for Australian locations"
.
bom.gov.au
.
Archived
from the original on 4 March 2016
. Retrieved
8 January
2020
.
- ^
"Climate statistics for Australian locations"
.
bom.gov.au
.
Archived
from the original on 27 December 2011
. Retrieved
8 January
2020
.
- ^
"Climate statistics for Australian locations"
.
bom.gov.au
.
Archived
from the original on 5 June 2011
. Retrieved
8 January
2020
.
- ^
"Climate statistics for Australian locations"
.
bom.gov.au
.
Archived
from the original on 13 August 2020
. Retrieved
8 January
2020
.
- ^
"Climate statistics for Australian locations"
.
bom.gov.au
.
Archived
from the original on 23 September 2015
. Retrieved
8 January
2020
.
- ^
"Climate statistics for Australian locations"
.
bom.gov.au
.
Archived
from the original on 9 July 2014
. Retrieved
8 January
2020
.
- ^
"Climate statistics for Australian locations"
.
bom.gov.au
.
Archived
from the original on 10 January 2010
. Retrieved
8 January
2020
.
- ^
Roaring Forties' shift south means more droughts for southern Australia
Archived
31 October 2022 at the
Wayback Machine
by Helen Davidson from
The Guardian
. 12 May 2014. Retrieved 3 September 2022.
- ^
a
b
Loffler, Ernst; Anneliese Loffler; A. J. Rose; Denis Warner (1983).
Australia: Portrait of a continent
. Richmond, Victoria: Hutchinson Group (Australia). pp. 37?39.
ISBN
978-0-09-130460-7
.
- ^
Rain
. Routledge. 1997.
ISBN
9780415125192
.
Archived
from the original on 12 September 2023
. Retrieved
7 May
2012
.
- ^
Official Year Book of the Commonwealth of Australia No.50-1964, p. 48
- ^
Kuleshow, Y; de Hoedt, G; Wright, W; Brewster, A (2002).
"Thunderstorm distribution and frequency in Australia"
(PDF)
.
Australian Meteorological Magazine
.
51
(3): 148.
ISSN
0004-9743
. Archived from
the original
(PDF)
on 11 January 2012
. Retrieved
23 November
2010
.
- ^
"Indian Ocean"
.
Bureau of Meteorology
.
Archived
from the original on 14 August 2020
. Retrieved
11 August
2020
.
- ^
"Northwest cloudbands"
.
Bureau of Meteorology
. 5 June 2013.
Archived
from the original on 6 August 2020
. Retrieved
11 August
2020
.
- ^
a
b
c
"Rainfall and Temperature Records"
.
Climate Extremes
. BOM. 28 February 2013.
Archived
from the original on 13 March 2014
. Retrieved
26 March
2014
.
- ^
"Climate Statistics for Babinda, QL"
.
Archived
from the original on 24 September 2015
. Retrieved
26 March
2014
.
- ^
Australia ? Climate of Our Continent
- ^
"Trentham snowy days (Woods Point, elevation 698 metres)"
.
AustralianWeatherNews
. Retrieved
13 September
2023
.
- ^
"Nimmitabel snowy days"
.
AustralianWeatherNews
. Retrieved
13 September
2023
.
- ^
"Bendoc and Aberfeldy snowy days"
.
AustralianWeatherNews
. Retrieved
13 September
2023
.
- ^
Heavy snow in southern Australia
Archived
20 May 2007 at the
Wayback Machine
,
BBC News
, 10 August 2005.
- ^
[1]
Archived
10 December 2013 at the
Wayback Machine
, 5 June 2014
- ^
"
"Statistics" Australian gov't"
.
Archived
from the original on 30 April 2019
. Retrieved
19 May
2013
.
- ^
"
"Statistics" Australian Gov't"
.
Archived
from the original on 27 September 2016
. Retrieved
27 September
2016
.
- ^
"BOM - Australian Climate Extremes"
.
www.bom.gov.au
. Archived from
the original
on 11 December 2000
. Retrieved
15 January
2022
.
- ^
"Australian daily extremes tables"
.
Bureau of Meteorology
. Commonwealth of Australia. 2021.
Archived
from the original on 25 May 2021
. Retrieved
25 May
2021
.
- ^
"Official records for Australia in July"
.
Daily Extremes
. BOM. 31 July 2013.
Archived
from the original on 23 September 2015
. Retrieved
25 March
2013
.
- ^
"Official records for Australia in January"
.
Australian Daily Extremes Tables
. BOM. 11 June 2019.
Archived
from the original on 14 August 2021
. Retrieved
11 June
2019
.
- ^
"Official records for Australia in January"
.
Daily Extremes
. BOM. 31 July 2013.
Archived
from the original on 23 September 2015
. Retrieved
12 March
2013
.
- ^
Birch, Laura (13 January 2022).
"Onslow in the Pilbara reaches 50.7C, equalling Australia's hottest day on record"
.
ABC News
.
Archived
from the original on 13 January 2022
. Retrieved
13 January
2022
.
- ^
"Official records for Australia in January"
.
Daily Extremes
. BOM. 31 July 2013.
Archived
from the original on 23 September 2015
. Retrieved
12 March
2013
.
- ^
"Official records for Australia in January"
.
Daily Extremes
. BOM. 31 July 2013.
Archived
from the original on 23 September 2015
. Retrieved
12 March
2013
.
- ^
a
b
"Official records for Australia in January"
.
Daily Extremes
. BOM. 31 July 2013.
Archived
from the original on 23 September 2015
. Retrieved
12 March
2013
.
- ^
"Australian daily extremes tables"
.
Bureau of Meteorology
. Commonwealth of Australia. 2021.
Archived
from the original on 25 May 2021
. Retrieved
25 May
2021
.
- ^
"Official records for Australia in January"
.
Daily Extremes
. BOM. 31 July 2013.
Archived
from the original on 23 September 2015
. Retrieved
12 March
2013
.
- ^
"Official records for Australia in January"
.
Daily Extremes
. BOM. 31 July 2013.
Archived
from the original on 23 September 2015
. Retrieved
12 March
2013
.
- ^
"Official records for Australia in January"
.
Daily Extremes
. BOM. 31 July 2013.
Archived
from the original on 23 September 2015
. Retrieved
12 March
2013
.
- ^
"Official records for Australia in January"
.
Daily Extremes
. BOM. 31 July 2013.
Archived
from the original on 23 September 2015
. Retrieved
12 March
2013
.
- ^
"Official records for Australia in January"
.
Daily Extremes
. BOM. 31 July 2013.
Archived
from the original on 23 September 2015
. Retrieved
12 March
2013
.
- ^
"Official records for Australia in January"
.
Daily Extremes
. BOM. 31 July 2013.
Archived
from the original on 23 September 2015
. Retrieved
12 March
2013
.
- ^
"Official records for Australia in January"
.
Daily Extremes
. BOM. 31 July 2013.
Archived
from the original on 23 September 2015
. Retrieved
12 March
2013
.
- ^
"Official records for Australia in January"
.
Daily Extremes
. BOM. 31 July 2013.
Archived
from the original on 12 September 2023
. Retrieved
12 March
2013
.
- ^
a
b
"Official records for Australia in January"
.
Daily Extremes
. BOM. 23 August 2020.
Archived
from the original on 7 April 2022
. Retrieved
3 September
2020
.
- ^
"Official records for Australia in January"
.
Daily Extremes
. BOM. 31 July 2013.
Archived
from the original on 23 September 2015
. Retrieved
12 March
2013
.
- ^
"Official records for Australia in January"
.
Daily Extremes
. BOM. 31 July 2013.
Archived
from the original on 23 September 2015
. Retrieved
12 March
2013
.
- ^
"Official records for Australia in January"
.
Daily Extremes
. BOM. 31 July 2013.
Archived
from the original on 23 September 2015
. Retrieved
12 March
2013
.
- ^
"Official records for Australia in January"
.
Daily Extremes
. BOM. 31 July 2013.
Archived
from the original on 23 September 2015
. Retrieved
12 March
2013
.
- ^
"Official records for Australia in January"
.
Daily Extremes
. BOM. 31 July 2013.
Archived
from the original on 23 September 2015
. Retrieved
12 March
2013
.
- ^
"Official records for Australia in January"
.
Daily Extremes
. BOM. 31 July 2013.
Archived
from the original on 23 September 2015
. Retrieved
12 March
2013
.
- ^
"Official records for Australia in December"
.
Daily Extremes
. BOM. 22 December 2019.
Archived
from the original on 15 August 2021
. Retrieved
23 December
2019
.
- ^
"Official records for Australia in January"
.
Daily Extremes
. BOM. 31 July 2013.
Archived
from the original on 23 September 2015
. Retrieved
12 March
2013
.
- ^
Bureau of Meteorology, Australian Government
- ^
Weather and Fire
Archived
20 May 2007 at the
Wayback Machine
, BOM. Retrieved 2 May 2007.
- ^
Australian Climate Extremes ? Fire
Archived
7 April 2007 at the
Wayback Machine
, BOM. Retrieved 2 May 2007.
- ^
"
'Extraordinary' 2019 ends with deadliest day of the worst fire season"
. Sydney Morning Herald. 1 January 2020.
Archived
from the original on 15 January 2020
. Retrieved
20 August
2022
.
- ^
"Australia fires: Life during and after the worst bushfires in history"
. BBC. 28 April 2020.
Archived
from the original on 15 July 2022
. Retrieved
20 August
2022
.
- ^
"Police: Australian fires create 'a holocaust'
"
. CNN. 9 February 2009.
Archived
from the original on 11 February 2009
. Retrieved
9 February
2009
.
- ^
a
b
"Drought"
.
Climate Glossary
. BOM. 2006.
Archived
from the original on 30 December 2019
. Retrieved
13 November
2006
.
- ^
Tapper, Nigel. & Hurry, Lynn. (1993) Australia's Weather Patterns: An Introductory Guide. pp. 51?57. Dellasta.
ISBN
1-875627-14-6
- ^
"Our Natural Resources at a Glance ? Climate"
.
Department of Agriculture, Fisheries and Forestry (Australia)
. 2006. Archived from
the original
on 19 September 2006
. Retrieved
13 November
2006
.
- ^
"Tornadoes in Australia: are we prepared?"
.
Australia Journal of Emergency Management
. July 2022
. Retrieved
22 February
2024
.
- ^
"When is the cyclone season?"
. BOM. 2007.
Archived
from the original on 18 November 2017
. Retrieved
10 May
2007
.
- ^
"What is the most cyclone-prone region in Australia?"
. BOM. 2007.
Archived
from the original on 18 November 2017
. Retrieved
10 May
2007
.
- ^
"Surviving Cyclones"
. BOM. 2007.
Archived
from the original on 9 May 2007
. Retrieved
10 May
2007
.
- ^
a
b
"Cyclone Yasi to cost insurers $3.5 bln ? forecaster"
. 3 February 2011.
Archived
from the original on 8 March 2011
. Retrieved
30 July
2011
.
- ^
"Australia's worst natural disasters"
. SBS World News Australia. Archived from
the original
on 5 March 2010
. Retrieved
30 July
2011
.
- ^
Foley, Mike (26 November 2021).
"CSIRO study proves climate change driving Australia's 800% boom in bushfires"
.
The Sydney Morning Herald
. Retrieved
17 February
2022
.
- ^
a
b
Green, Donna (November 2006).
"Climate Change and Health: Impacts on Remote Indigenous Communities in Northern Australia"
.
Commonwealth Scientific and Industrial Research Organisation
.
S2CID
131620899
.
- ^
Nursey-Bray, Melissa; Palmer, R.; Smith, T. F.; Rist, P. (4 May 2019).
"Old ways for new days: Australian Indigenous peoples and climate change"
.
Local Environment
.
24
(5): 473?486.
Bibcode
:
2019LoEnv..24..473N
.
doi
:
10.1080/13549839.2019.1590325
.
ISSN
1354-9839
.
- ^
Ford, James D. (July 2012).
"Indigenous Health and Climate Change"
.
American Journal of Public Health
.
102
(7): 1260?1266.
doi
:
10.2105/AJPH.2012.300752
.
ISSN
0090-0036
.
PMC
3477984
.
PMID
22594718
.
- ^
"Australia's changing climate"
.
- ^
Lindenmayer, David; Dovers, Stephen; Morton, Steve, eds. (2014).
Ten Commitments Revisited
. CSIRO Publishing.
ISBN
978-1-4863-0167-6
.
- ^
Johnston, Tim (3 October 2007).
"Climate change becomes urgent security issue in Australia"
.
The New York Times
. Retrieved
29 June
2011
.
- ^
Preston, B. L.; Jones, R. N. (2006).
Climate Change Impacts on Australia and the Benefits of Early Action to Reduce Global Greenhouse Gas Emissions: A consultancy report for the Australian Business Roundtable on Climate Change
(PDF)
.
CSIRO
.
- ^
Perkins, Miki (13 November 2020).
"Climate change is already here: major scientific report"
. Sydney Morning Herald
. Retrieved
13 November
2020
.
- ^
a
b
Zander, Kerstin K.; Petheram, Lisa; Garnett, Stephen T. (1 June 2013). "Stay or leave? Potential climate change adaptation strategies among Aboriginal people in coastal communities in northern Australia".
Natural Hazards
.
67
(2): 591?609.
Bibcode
:
2013NatHa..67..591Z
.
doi
:
10.1007/s11069-013-0591-4
.
ISSN
1573-0840
.
S2CID
128543022
.
- ^
Morton, Adam (5 September 2023).
"Australia has highest per capita CO2 emissions from coal in G20, analysis finds"
.
The Guardian
.
ISSN
0261-3077
. Retrieved
12 February
2024
.
- ^
Pittock, Barrie, ed. (2003).
Climate Change: An Australian Guide to the Science and Potential Impacts
(PDF)
. Commonwealth of Australia:
Australian Greenhouse Office
.
ISBN
978-1-920840-12-9
. Archived from
the original
(PDF)
on 5 March 2019
. Retrieved
3 November
2019
.
External links
|
|---|
| Sovereign states
| |
|---|
Associated states
of New Zealand
| |
|---|
Dependencies
and other territories
| |
|---|