Study of astronomy using spectroscopy to measure the spectrum of electromagnetic radiation
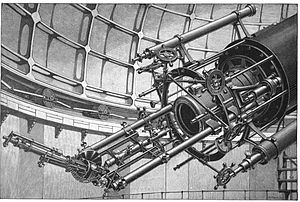 The Star-Spectroscope of the
Lick Observatory
in 1898. Designed by
James Keeler
and constructed by
John Brashear
.
The Star-Spectroscope of the
Lick Observatory
in 1898. Designed by
James Keeler
and constructed by
John Brashear
.
Astronomical spectroscopy
is the study of
astronomy
using the techniques of
spectroscopy
to measure the
spectrum
of
electromagnetic radiation
, including
visible light
,
ultraviolet
,
X-ray
,
infrared
and
radio
waves that
radiate
from
stars
and other celestial objects. A
stellar spectrum
can reveal many properties of stars, such as their chemical composition, temperature, density, mass, distance and luminosity. Spectroscopy can show the velocity of motion towards or away from the observer by measuring the
Doppler shift
. Spectroscopy is also used to study the physical properties of many other types of celestial objects such as
planets
,
nebulae
,
galaxies
, and
active galactic nuclei
.
Background
[
edit
]
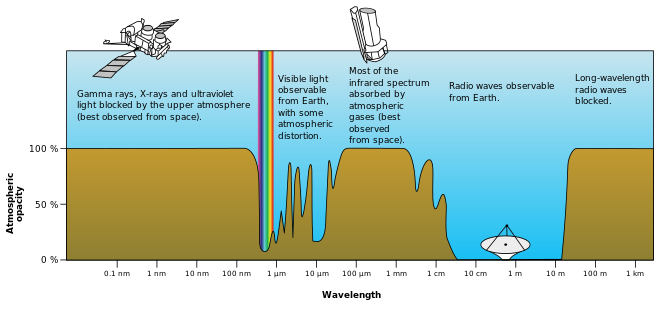 Opacity of the Earth's atmosphere for different wavelengths of
electromagnetic radiation
. The atmosphere blocks some wavelengths but it is mostly transparent for visible light and a wide range of radio waves.
Opacity of the Earth's atmosphere for different wavelengths of
electromagnetic radiation
. The atmosphere blocks some wavelengths but it is mostly transparent for visible light and a wide range of radio waves.
Astronomical spectroscopy is used to measure three major bands of radiation in the electromagnetic spectrum:
visible light
,
radio waves
, and
X-rays
. While all spectroscopy looks at specific bands of the spectrum, different methods are required to acquire the signal depending on the frequency.
Ozone
(O
3
) and molecular oxygen (O
2
) absorb light with wavelengths under 300 nm, meaning that X-ray and
ultraviolet
spectroscopy require the use of a satellite telescope or
rocket mounted detectors
.
[1]
: 27
Radio signals have much longer wavelengths than optical signals, and require the use of
antennas or radio dishes
.
Infrared
light is absorbed by atmospheric water and carbon dioxide, so while the equipment is similar to that used in optical spectroscopy, satellites are required to record much of the infrared spectrum.
[2]
Optical spectroscopy
[
edit
]
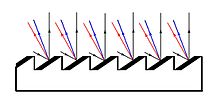 With a
reflection grating
, incident light is separated into several diffraction orders which separate different wavelengths apart (red and blue lines), excepting the 0-th order (black).
With a
reflection grating
, incident light is separated into several diffraction orders which separate different wavelengths apart (red and blue lines), excepting the 0-th order (black).
Physicists have been looking at the solar spectrum since
Isaac Newton
first used a simple prism to observe the refractive properties of light.
[3]
In the early 1800s
Joseph von Fraunhofer
used his skills as a glassmaker to create very pure prisms, which allowed him to observe 574 dark lines in a seemingly continuous spectrum.
[4]
Soon after this, he combined telescope and prism to observe the spectrum of
Venus
, the
Moon
,
Mars
, and various stars such as
Betelgeuse
; his company continued to manufacture and sell high-quality refracting telescopes based on his original designs until its closure in 1884.
[5]
: 28?29
The resolution of a prism is limited by its size; a larger prism will provide a more detailed spectrum, but the increase in mass makes it unsuitable for highly detailed work.
[6]
This issue was resolved in the early 1900s with the development of high-quality reflection gratings by
J.S. Plaskett
at the
Dominion Observatory
in Ottawa, Canada.
[5]
: 11
Light striking a mirror will reflect at the same angle, however a small portion of the light will be refracted at a different angle; this is dependent upon the indices of refraction of the materials and the wavelength of the light.
[7]
By creating a
"blazed" grating
which utilizes a large number of parallel mirrors, the small portion of light can be focused and visualized. These new spectroscopes were more detailed than a prism, required less light, and could be focused on a specific region of the spectrum by tilting the grating.
[6]
The limitation to a blazed grating is the width of the mirrors, which can only be ground a finite amount before focus is lost; the maximum is around 1000 lines/mm. In order to overcome this limitation holographic gratings were developed. Volume phase holographic gratings use a thin film of dichromated gelatin on a glass surface, which is subsequently exposed to a
wave pattern
created by an
interferometer
. This wave pattern sets up a reflection pattern similar to the blazed gratings but utilizing
Bragg diffraction
, a process where the angle of reflection is dependent on the arrangement of the atoms in the gelatin. The holographic gratings can have up to 6000 lines/mm and can be up to twice as efficient in collecting light as blazed gratings. Because they are sealed between two sheets of glass, the holographic gratings are very versatile, potentially lasting decades before needing replacement.
[8]
Light
dispersed
by the grating or prism in a
spectrograph
can be recorded by a detector. Historically,
photographic plates
were widely used to record spectra until electronic detectors were developed, and today optical spectrographs most often employ
charge-coupled devices
(CCDs). The wavelength scale of a spectrum can be
calibrated
by observing the spectrum of
emission lines
of known wavelength from a
gas-discharge lamp
. The
flux
scale of a spectrum can be calibrated as a function of wavelength by comparison with an observation of a standard star with corrections for atmospheric absorption of light; this is known as
spectrophotometry
.
[9]
Radio spectroscopy
[
edit
]
Radio astronomy
was founded with the work of
Karl Jansky
in the early 1930s, while working for
Bell Labs
. He built a radio antenna to look at potential sources of interference for transatlantic radio transmissions. One of the sources of noise discovered came not from Earth, but from the center of the
Milky Way
, in the constellation
Sagittarius
.
[10]
In 1942,
JS Hey
captured the Sun's radio frequency using military radar receivers.
[1]
: 26
Radio spectroscopy started with the discovery of the
21-centimeter H I line
in 1951.
Radio interferometry
[
edit
]
Radio interferometry
was pioneered in 1946, when
Joseph Lade Pawsey
,
Ruby Payne-Scott
and Lindsay McCready used a
single antenna atop a sea cliff
to observe 200 MHz solar radiation. Two incident beams, one directly from the sun and the other reflected from the sea surface, generated the necessary interference.
[11]
The first multi-receiver interferometer was built in the same year by
Martin Ryle
and Vonberg.
[12]
[13]
In 1960, Ryle and
Antony Hewish
published the technique of
aperture synthesis
to analyze interferometer data.
[14]
The aperture synthesis process, which involves
autocorrelating
and
discrete Fourier transforming
the incoming signal, recovers both the spatial and frequency variation in flux.
[15]
The result is a
3D image
whose third axis is frequency. For this work, Ryle and Hewish were jointly awarded the 1974
Nobel Prize in Physics
.
[16]
X-ray spectroscopy
[
edit
]
Stars and their properties
[
edit
]
Chemical properties
[
edit
]
Newton used a prism to split white light into a spectrum of color, and Fraunhofer's high-quality prisms allowed scientists to see dark lines of an unknown origin. In the 1850s,
Gustav Kirchhoff
and
Robert Bunsen
described the phenomena behind these dark lines. Hot solid objects produce light with a
continuous spectrum
, hot gases emit light at specific wavelengths, and hot solid objects surrounded by cooler gases show a near-continuous spectrum with dark lines corresponding to the emission lines of the gases.
[5]
: 42?44
[17]
By comparing the
absorption lines
of the Sun with
emission spectra
of known gases, the chemical composition of stars can be determined.
The major
Fraunhofer lines
, and the elements with which they are associated, appear in the following table. Designations from the early
Balmer Series
are shown in parentheses.
| Designation
|
Element
|
Wavelength (
nm
)
|
| y
|
O
2
|
898.765
|
| Z
|
O
2
|
822.696
|
| A
|
O
2
|
759.370
|
| B
|
O
2
|
686.719
|
| C (Hα)
|
H
|
656.281
|
| a
|
O
2
|
627.661
|
| D
1
|
Na
|
589.592
|
| D
2
|
Na
|
588.995
|
| D
3
or d
|
He
|
587.5618
|
| e
|
Hg
|
546.073
|
| E
2
|
Fe
|
527.039
|
| b
1
|
Mg
|
518.362
|
| b
2
|
Mg
|
517.270
|
| b
3
|
Fe
|
516.891
|
| b
4
|
Mg
|
516.733
|
|
| Designation
|
Element
|
Wavelength (
nm
)
|
| c
|
Fe
|
495.761
|
| F (Hβ)
|
H
|
486.134
|
| d
|
Fe
|
466.814
|
| e
|
Fe
|
438.355
|
| G' (Hγ)
|
H
|
434.047
|
| G
|
Fe
|
430.790
|
| G
|
Ca
|
430.774
|
| h (Hδ)
|
H
|
410.175
|
| H
|
Ca
+
|
396.847
|
| K
|
Ca
+
|
393.368
|
| L
|
Fe
|
382.044
|
| N
|
Fe
|
358.121
|
| P
|
Ti
+
|
336.112
|
| T
|
Fe
|
302.108
|
| t
|
Ni
|
299.444
|
|
Not all of the elements in the Sun were immediately identified. Two examples are listed below:
- In 1868
Norman Lockyer
and
Pierre Janssen
independently observed a line next to the sodium doublet (D
1
and D
2
) which Lockyer determined to be a new element. He named it
Helium
, but it wasn't until 1895 the element was found on Earth.
[5]
: 84?85
- In 1869 the astronomers
Charles Augustus Young
and
William Harkness
independently observed a novel green emission line in the
Sun's corona
during an eclipse. This "new" element was incorrectly named
coronium
, as it was only found in the corona. It was not until the 1930s that
Walter Grotrian
and
Bengt Edlen
discovered that the spectral line at 530.3 nm was due to
highly ionized
iron (Fe
13+
).
[18]
Other unusual lines in the coronal spectrum are also caused by highly charged ions, such as
nickel
and
calcium
, the high ionization being due to the extreme temperature of the
solar corona
.
[1]
: 87, 297
To date more than 20 000 absorption lines have been listed for the
Sun
between 293.5 and 877.0 nm, yet only approximately 75% of these lines have been linked to elemental absorption.
[1]
: 69
By analyzing the
equivalent width
of each spectral line in an emission spectrum, both the elements present in a star and their relative abundances can be determined.
[7]
Using this information stars can be categorized into
stellar populations
; Population I stars are the youngest stars and have the highest metal content (the Sun is a Pop I star), while Population III stars are the oldest stars with a very low metal content.
[19]
[20]
Temperature and size
[
edit
]
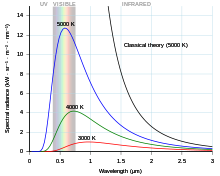 Black body curves for various temperatures.
In 1860
Gustav Kirchhoff
proposed the idea of a
black body
, a material that emits electromagnetic radiation at all wavelengths.
[21]
[22]
In 1894
Wilhelm Wien
derived an expression relating the temperature (T) of a black body to its peak emission wavelength (λ
max
):
[23]

b
is a
constant of proportionality
called
Wien's displacement constant
, equal to
2.897
771
955
...
×
10
?3
m?K
.
[24]
This equation is called
Wien's Law
. By measuring the peak wavelength of a star, the surface temperature can be determined.
[17]
For example, if the peak wavelength of a star is 502 nm the corresponding temperature will be 5772
kelvins
.
The
luminosity
of a star is a measure of the
electromagnetic energy
output in a given amount of time.
[25]
Luminosity (L) can be related to the temperature (T) of a star by:
 ,
,
where R is the radius of the star and σ is the
Stefan?Boltzmann
constant, with a value of
5.670
374
419
...
×
10
?8
W?m
?2
?K
?4
.
[26]
Thus, when both luminosity and temperature are known (via direct measurement and calculation) the radius of a star can be determined.
Galaxies
[
edit
]
The spectra of
galaxies
look similar to stellar spectra, as they consist of the combined light of billions of stars.
Doppler shift studies of
galaxy clusters
by
Fritz Zwicky
in 1937 found that the galaxies in a cluster were moving much faster than seemed to be possible from the mass of the cluster inferred from the visible light. Zwicky hypothesized that there must be a great deal of non-luminous matter in the galaxy clusters, which became known as
dark matter
.
[27]
Since his discovery, astronomers have determined that a large portion of galaxies (and most of the universe) is made up of dark matter. In 2003, however, four galaxies (NGC 821,
NGC 3379
, NGC 4494, and
NGC 4697
) were found to have little to no dark matter influencing the motion of the stars contained within them; the reason behind the lack of dark matter is unknown.
[28]
In the 1950s, strong radio sources were found to be associated with very dim, very red objects. When the first spectrum of one of these objects was taken there were absorption lines at wavelengths where none were expected. It was soon realised that what was observed was a normal galactic spectrum, but highly red shifted.
[29]
[30]
These were named
quasi-stellar radio sources
, or
quasars
, by
Hong-Yee Chiu
in 1964.
[31]
Quasars are now thought to be galaxies formed in the early years of our universe, with their extreme energy output powered by super-massive
black holes
.
[30]
The properties of a galaxy can also be determined by analyzing the stars found within them.
NGC 4550
, a galaxy in the Virgo Cluster, has a large portion of its stars rotating in the opposite direction as the other portion. It is believed that the galaxy is the combination of two smaller galaxies that were rotating in opposite directions to each other.
[32]
Bright stars in galaxies can also help determine the distance to a galaxy, which may be a more accurate method than
parallax
or
standard candles
.
[33]
Interstellar medium
[
edit
]
The interstellar medium is matter that occupies the space between
star systems
in a galaxy. 99% of this matter is gaseous ?
hydrogen
,
helium
, and smaller quantities of other ionized elements such as
oxygen
. The other 1% is dust particles, thought to be mainly
graphite
,
silicates
, and ices.
[34]
Clouds of the dust and gas are referred to as
nebulae
.
There are three main types of nebula:
absorption
,
reflection
, and
emission
nebulae. Absorption (or dark) nebulae are made of dust and gas in such quantities that they obscure the starlight behind them, making
photometry
difficult. Reflection nebulae, as their name suggest, reflect the light of nearby stars. Their spectra are the same as the stars surrounding them, though the light is bluer; shorter wavelengths scatter better than longer wavelengths. Emission nebulae emit light at specific wavelengths depending on their chemical composition.
[34]
Gaseous emission nebulae
[
edit
]
In the early years of astronomical spectroscopy, scientists were puzzled by the spectrum of gaseous nebulae. In 1864
William Huggins
noticed that many nebulae showed only emission lines rather than a full spectrum like stars. From the work of Kirchhoff, he concluded that nebulae must contain "enormous masses of luminous gas or vapour."
[35]
However, there were several emission lines that could not be linked to any terrestrial element, brightest among them lines at 495.9 nm and 500.7 nm.
[36]
These lines were attributed to a new element,
nebulium
, until
Ira Bowen
determined in 1927 that the emission lines were from highly ionised oxygen (O
+2
).
[37]
[38]
These emission lines could not be replicated in a laboratory because they are
forbidden lines
; the low density of a nebula (one atom per cubic centimetre)
[34]
allows for
metastable
ions to decay via forbidden line emission rather than collisions with other atoms.
[36]
Not all emission nebulae are found around or near stars where solar heating causes ionisation. The majority of gaseous emission nebulae are formed of neutral hydrogen. In the
ground state
neutral hydrogen has two possible
spin states
: the
electron
has either the same spin or the opposite spin of the
proton
. When the atom transitions between these two states, it releases an emission or absorption line of 21 cm.
[34]
This line is within the radio range and allows for very precise measurements:
[36]
- Velocity of the cloud can be measured via
Doppler shift
- The intensity of the 21 cm line gives the density and number of atoms in the cloud
- The temperature of the cloud can be calculated
Using this information, the shape of the Milky Way has been determined to be a
spiral galaxy
, though the exact number and position of the spiral arms is the subject of ongoing research.
[39]
Complex molecules
[
edit
]
Dust and molecules in the interstellar medium not only obscures photometry, but also causes absorption lines in spectroscopy. Their spectral features are generated by transitions of component electrons between different energy levels, or by rotational or vibrational spectra. Detection usually occurs in radio, microwave, or infrared portions of the spectrum.
[40]
The chemical reactions that form these molecules can happen in cold, diffuse clouds
[41]
or in dense regions illuminated with
ultraviolet
light.
[42]
Most known compounds in space are
organic
, ranging from small molecules e.g.
acetylene
C
2
H
2
and
acetone
(CH
3
)
2
CO;
[43]
to entire classes of large molecule e.g.
fullerenes
[42]
and
polycyclic aromatic hydrocarbons
; to
solids
, such as
graphite
or other
sooty
material.
[44]
Motion in the universe
[
edit
]
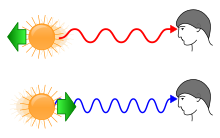 Redshift and blueshift
Stars and interstellar gas are bound by gravity to form galaxies, and groups of galaxies can be bound by gravity in
galaxy clusters
.
[45]
With the exception of stars in the
Milky Way
and the galaxies in the
Local Group
, almost all galaxies are moving away from Earth due to the
expansion of the universe
.
[18]
Doppler effect and redshift
[
edit
]
The motion of stellar objects can be determined by looking at their spectrum. Because of the
Doppler effect
, objects moving towards someone are
blueshifted
, and objects moving away are
redshifted
. The wavelength of redshifted light is longer, appearing redder than the source. Conversely, the wavelength of blueshifted light is shorter, appearing bluer than the source light:

where
 is the emitted wavelength,
 is the velocity of the object, and
 is the observed wavelength. Note that v<0 corresponds to λ<λ
0
, a blueshifted wavelength. A redshifted absorption or emission line will appear more towards the red end of the spectrum than a stationary line. In 1913
Vesto Slipher
determined the
Andromeda Galaxy
was blueshifted, meaning it was moving towards the Milky Way. He recorded the spectra of 20 other galaxies ? all but four of which were redshifted ? and was able to calculate their velocities relative to the Earth.
Edwin Hubble
would later use this information, as well as his own observations, to define
Hubble's law
: The further a galaxy is from the Earth, the faster it is moving away.
[18]
[46]
Hubble's law can be generalised to:
is the observed wavelength. Note that v<0 corresponds to λ<λ
0
, a blueshifted wavelength. A redshifted absorption or emission line will appear more towards the red end of the spectrum than a stationary line. In 1913
Vesto Slipher
determined the
Andromeda Galaxy
was blueshifted, meaning it was moving towards the Milky Way. He recorded the spectra of 20 other galaxies ? all but four of which were redshifted ? and was able to calculate their velocities relative to the Earth.
Edwin Hubble
would later use this information, as well as his own observations, to define
Hubble's law
: The further a galaxy is from the Earth, the faster it is moving away.
[18]
[46]
Hubble's law can be generalised to:

where
 is the velocity (or Hubble Flow),
 is the
Hubble Constant
, and
is the
Hubble Constant
, and
 is the distance from Earth.
Redshift (z) can be expressed by the following equations:
[47]
Calculation of redshift,

| Based on wavelength
|
Based on frequency
|

|

|

|

|
In these equations, frequency is denoted by
 and wavelength by
. The larger the value of z, the more redshifted the light and the farther away the object is from the Earth. As of January 2013, the largest galaxy redshift of z~12 was found using the
Hubble Ultra-Deep Field
, corresponding to an age of over 13 billion years (the universe is approximately 13.82 billion years old).
[48]
[49]
[50]
and wavelength by
. The larger the value of z, the more redshifted the light and the farther away the object is from the Earth. As of January 2013, the largest galaxy redshift of z~12 was found using the
Hubble Ultra-Deep Field
, corresponding to an age of over 13 billion years (the universe is approximately 13.82 billion years old).
[48]
[49]
[50]
The Doppler effect and Hubble's law can be combined to form the equation
 ,
where c is the speed of light.
,
where c is the speed of light.
Peculiar motion
[
edit
]
Objects that are gravitationally bound will rotate around a common center of mass. For stellar bodies, this motion is known as
peculiar velocity
and can alter the Hubble Flow. Thus, an extra term for the peculiar motion needs to be added to Hubble's law:
[51]

This motion can cause confusion when looking at a solar or galactic spectrum, because the expected redshift based on the simple Hubble law will be obscured by the peculiar motion. For example, the shape and size of the
Virgo Cluster
has been a matter of great scientific scrutiny due to the very large peculiar velocities of the galaxies in the cluster.
[52]
Binary stars
[
edit
]
 Two stars of different size orbiting the center of mass. The spectrum can be seen to split depending on the position and velocity of the stars.
Just as planets can be gravitationally bound to stars, pairs of stars can orbit each other. Some
binary stars
are visual binaries, meaning they can be observed orbiting each other through a telescope. Some binary stars, however, are too close together to be
resolved
.
[53]
These two stars, when viewed through a spectrometer, will show a composite spectrum: the spectrum of each star will be added together. This composite spectrum becomes easier to detect when the stars are of similar luminosity and of different
spectral class
.
[54]
Spectroscopic binaries
can be also detected due to their
radial velocity
; as they orbit around each other one star may be moving towards the Earth whilst the other moves away, causing a Doppler shift in the composite spectrum. The
orbital plane
of the system determines the magnitude of the observed shift: if the observer is looking perpendicular to the orbital plane there will be no observed radial velocity.
[53]
[54]
For example, a person looking at a
carousel
from the side will see the animals moving toward and away from them, whereas if they look from directly above they will only be moving in the horizontal plane.
Planets, asteroids, and comets
[
edit
]
Planets
,
asteroids
, and
comets
all reflect light from their parent stars and emit their own light. For cooler objects, including
Solar System
planets and asteroids, most of the emission is at infrared wavelengths we cannot see, but that are routinely measured with
spectrometers
. For objects surrounded by gas, such as comets and planets with atmospheres, further emission and absorption happens at specific wavelengths in the gas, imprinting the spectrum of the gas on that of the solid object. In the case of worlds with thick atmospheres or complete cloud or haze cover (such as the four
giant planets
,
Venus
, and
Saturn
's satellite
Titan
), the spectrum is mostly or completely due to the atmosphere alone.
[55]
Planets
[
edit
]
The reflected light of a planet contains absorption bands due to
minerals
in the rocks present for rocky bodies, or due to the elements and molecules present in the atmosphere. To date over 3,500
exoplanets
have been discovered. These include so-called
Hot Jupiters
, as well as Earth-like planets. Using spectroscopy, compounds such as alkali metals, water vapor, carbon monoxide, carbon dioxide, and methane have all been discovered.
[56]
Asteroids
[
edit
]
Asteroids can be classified into three major types according to their spectra. The original categories were created by Clark R. Chapman, David Morrison, and Ben Zellner in 1975, and further expanded by
David J. Tholen
in 1984. In what is now known as the
Tholen classification
, the
C-types
are made of carbonaceous material,
S-types
consist mainly of
silicates
, and
X-types
are 'metallic'. There are other classifications for unusual asteroids. C- and S-type asteroids are the most common asteroids. In 2002 the Tholen classification was further "evolved" into the
SMASS classification
, expanding the number of categories from 14 to 26 to account for more precise spectroscopic analysis of the asteroids.
[57]
[58]
Comets
[
edit
]
 Optical spectrum of
Comet Hyakutake
.
Optical spectrum of
Comet Hyakutake
.
The spectra of comets consist of a reflected solar spectrum from the dusty clouds surrounding the comet, as well as emission lines from gaseous atoms and molecules excited to
fluorescence
by sunlight and/or chemical reactions. For example, the chemical composition of
Comet ISON
[59]
was determined by spectroscopy due to the prominent emission lines of cyanogen (CN), as well as two- and three-carbon atoms (C
2
and C
3
).
[60]
Nearby comets can even be seen in X-ray as solar wind ions flying to the
coma
are neutralized. The cometary X-ray spectra therefore reflect the state of the solar wind rather than that of the comet.
[61]
See also
[
edit
]
References
[
edit
]
- ^
a
b
c
d
Foukal, Peter V. (2004).
Solar Astrophysics
. Weinheim: Wiley VCH. p. 69.
ISBN
3-527-40374-4
.
- ^
"Cool Cosmos ? Infrared Astronomy"
. California Institute of Technology. Archived from
the original
on 11 October 2018
. Retrieved
23 October
2013
.
- ^
Newton, Isaac (1705).
Opticks: Or, A Treatise of the Reflections, Refractions, Inflections and Colours of Light
. London: Royal Society. pp. 13?19.
- ^
Fraunhofer, Joseph (1817).
"Bestimmung des Brechungs- und des Farben-Zerstreuungs ? Vermogens verschiedener Glasarten, in Bezug auf die Vervollkommnung achromatischer Fernrohre"
.
Annalen der Physik
.
56
(7): 282?287.
Bibcode
:
1817AnP....56..264F
.
doi
:
10.1002/andp.18170560706
.
- ^
a
b
c
d
Hearnshaw, J.B. (1986).
The analysis of starlight
. Cambridge: Cambridge University Press.
ISBN
0-521-39916-5
.
- ^
a
b
Kitchin, C.R. (1995).
Optical Astronomical Spectroscopy
. Bristol: Institute of Physics Publishing. pp. 127, 143.
ISBN
0-7503-0346-8
.
- ^
a
b
Ball, David W. (2001).
Basics of Spectroscopy
. Bellingham, Washington: Society of Photo-Optical Instrumentation Engineers. pp. 24, 28.
ISBN
0-8194-4104-X
.
- ^
Barden, S.C.; Arns, J.A.; Colburn, W.S. (July 1998). d'Odorico, Sandro (ed.).
"Volume-phase holographic gratings and their potential for astronomical applications"
(PDF)
.
Proc. SPIE
. Optical Astronomical Instrumentation.
3355
: 866?876.
Bibcode
:
1998SPIE.3355..866B
.
CiteSeerX
10.1.1.25.5736
.
doi
:
10.1117/12.316806
.
S2CID
17445305
. Archived from
the original
(PDF)
on 2010-07-28
. Retrieved
2019-09-12
.
- ^
Oke, J. B.; Gunn, J. E. (1983). "Secondary standard stars for absolute spectrophotometry".
The Astrophysical Journal
.
266
: 713.
Bibcode
:
1983ApJ...266..713O
.
doi
:
10.1086/160817
.
- ^
Ghigo, F.
"Karl Jansky"
.
National Radio Astronomy Observatory
. Associated Universities, Inc
. Retrieved
24 October
2013
.
- ^
Pawsey, Joseph; Payne-Scott, Ruby; McCready, Lindsay (1946). "Radio-Frequency Energy from the Sun".
Nature
.
157
(3980): 158?159.
Bibcode
:
1946Natur.157..158P
.
doi
:
10.1038/157158a0
.
PMID
21015114
.
S2CID
4056021
.
- ^
Ryle, M.; Vonberg, D. D. (1946). "Solar Radiation on 175 Mc./s".
Nature
.
158
(4010): 339?340.
Bibcode
:
1946Natur.158..339R
.
doi
:
10.1038/158339b0
.
S2CID
4097569
.
- ^
Robertson, Peter (1992).
Beyond southern skies: radio astronomy and the Parkes telescope
. University of Cambridge. pp. 42, 43.
ISBN
0-521-41408-3
.
- ^
W. E. Howard.
"A Chronological History of Radio Astronomy"
(PDF)
. Archived from
the original
(PDF)
on 2012-07-14
. Retrieved
2 December
2013
.
- ^
"How Radio Telescopes Work"
. Archived from
the original
on 3 December 2013
. Retrieved
2 December
2013
.
- ^
"Press Release: The 1974 Nobel Prize in Physics"
. Retrieved
2 December
2013
.
- ^
a
b
Jenkins, Francis A.; Harvey E. White (1957).
Fundamentals of Optics
(4th ed.). New York: McGraw-Hill. pp.
430?437
.
ISBN
0-07-085346-0
.
- ^
a
b
c
Morison, Ian (2008).
Introduction to Astronomy and Cosmology
(PDF)
. Wiley-Blackwell. p. 61.
ISBN
978-0-470-03333-3
. Archived from
the original
(PDF)
on 2013-10-29.
- ^
Gregory, Stephen A.; Michael Zeilik (1998).
Introductory astronomy & astrophysics
(4. ed.). Fort Worth [u.a.]: Saunders College Publ. p. 322.
ISBN
0-03-006228-4
.
- ^
Pan, Liubin; Scannapieco, Evan; Scalo, Jon (1 October 2013). "Modeling the Pollution of Pristine Gas in the Early Universe".
The Astrophysical Journal
.
775
(2): 111.
arXiv
:
1306.4663
.
Bibcode
:
2013ApJ...775..111P
.
doi
:
10.1088/0004-637X/775/2/111
.
S2CID
119233184
.
- ^
G. Kirchhoff (July 1860).
"On the relation between the radiating and absorbing powers of different bodies for light and heat"
.
The London, Edinburgh, and Dublin Philosophical Magazine and Journal of Science
.
20
(130). Taylor & Francis.
- ^
Nahar, Anil K. Pradhan, Sultana N. (2010).
Atomic astrophysics and spectroscopy
. Cambridge: Cambridge University Press. pp. 7, 221.
ISBN
978-0-521-82536-8
.
{{
cite book
}}
: CS1 maint: multiple names: authors list (
link
)
- ^
Mahmoud Massoud (2005).
"§ 2.1 Blackbody radiation"
.
Engineering thermofluids: thermodynamics, fluid mechanics, and heat transfer
. Springer. p. 568.
ISBN
3-540-22292-8
.
- ^
"2022 CODATA Value: Wien wavelength displacement law constant"
.
The NIST Reference on Constants, Units, and Uncertainty
.
NIST
. May 2024
. Retrieved
2024-05-18
.
- ^
"Luminosity of Stars"
.
Australia Telescope National Facility
. 12 July 2004. Archived from
the original
on 9 August 2014
. Retrieved
2 July
2012
.
- ^
"2022 CODATA Value: Stefan?Boltzmann constant"
.
The NIST Reference on Constants, Units, and Uncertainty
.
NIST
. May 2024
. Retrieved
2024-05-18
.
- ^
Zwicky, F. (October 1937).
"On the Masses of Nebulae and of Clusters of Nebulae"
.
The Astrophysical Journal
.
86
: 217.
Bibcode
:
1937ApJ....86..217Z
.
doi
:
10.1086/143864
.
- ^
Romanowsky, Aaron J.; Douglas, Nigel G.; Arnaboldi, Magda; Kuijken, Konrad; Merrifield, Michael R.; Napolitano, Nicola R.; Capaccioli, Massimo; Freeman, Kenneth C. (19 September 2003). "A Dearth of Dark Matter in Ordinary Elliptical Galaxies".
Science
.
301
(5640): 1696?1698.
arXiv
:
astro-ph/0308518
.
Bibcode
:
2003Sci...301.1696R
.
doi
:
10.1126/science.1087441
.
PMID
12947033
.
S2CID
120137872
.
- ^
Matthews, Thomas A.; Sandage, Allan R. (July 1963).
"Optical Identification of 3c 48, 3c 196, and 3c 286 with Stellar Objects"
.
The Astrophysical Journal
.
138
: 30.
Bibcode
:
1963ApJ...138...30M
.
doi
:
10.1086/147615
.
- ^
a
b
Wallace, P.R. (1991).
Physics : imagination and reality
. Singapore: World Scientific. pp. 235?246.
ISBN
997150930X
.
- ^
Chiu, Hong-Yee (1964).
"Gravitational collapse"
.
Physics Today
.
17
(5): 21?34.
Bibcode
:
1964PhT....17e..21C
.
doi
:
10.1063/1.3051610
.
- ^
Rubin, Vera C.; Graham, J. A.; Kenney, Jeffrey D. P. (July 1992).
"Cospatial counterrotating stellar disks in the Virgo E7/S0 galaxy NGC 4550"
.
The Astrophysical Journal
.
394
: L9.
Bibcode
:
1992ApJ...394L...9R
.
doi
:
10.1086/186460
.
- ^
Kudritzki, R.-P. (May 2010). "Dissecting galaxies with quantitative spectroscopy of the brightest stars in the Universe".
Astronomische Nachrichten
.
331
(5): 459?473.
arXiv
:
1002.5039
.
Bibcode
:
2010AN....331..459K
.
doi
:
10.1002/asna.200911342
.
S2CID
119211740
.
- ^
a
b
c
d
Kitchin, C.R. (1987).
Stars, nebulae, and the interstellar medium : observational physics and astrophysics
. Bristol: A. Hilger. pp. 265?277.
ISBN
0-85274-580-X
.
- ^
Huggins, Sir William (1899).
The Scientific Papers of Sir William Huggins
. London: William Wesley and Son. pp. 114?115.
- ^
a
b
c
Tennyson, Jonathan (2005).
Astronomical spectroscopy : an introduction to the atomic and molecular physics of astronomical spectra
([Online-Ausg.]. ed.). London: Imperial College Press. pp. 46?47, 99?100.
ISBN
1-86094-513-9
.
- ^
Hirsh, Richard F (June 1979). "The Riddle of the Gaseous Nebulae".
Isis
.
70
(2): 162?212.
Bibcode
:
1979Isis...70..197H
.
doi
:
10.1086/352195
.
JSTOR
230787
.
S2CID
123234614
.
- ^
Bowen, I. S. (1 October 1927).
"The Origin of the Nebulium Spectrum"
.
Nature
.
120
(3022): 473.
Bibcode
:
1927Natur.120..473B
.
doi
:
10.1038/120473a0
.
S2CID
4066813
.
- ^
Efremov, Yu. N. (22 February 2011). "On the spiral structure of the Milky Way Galaxy".
Astronomy Reports
.
55
(2): 108?122.
arXiv
:
1011.4576
.
Bibcode
:
2011ARep...55..108E
.
doi
:
10.1134/S1063772911020016
.
S2CID
55372968
.
- ^
Shu, Frank H. (1982).
The physical universe : an introduction to astronomy
(12. [Dr.]. ed.). Sausalito, Calif.: Univ. Science Books. pp.
232?234
.
ISBN
0-935702-05-9
.
- ^
Hudson, Reggie L.
"The Interstellar Medium"
. Goddard Space Flight Center Astrochemistry Laboratory. Archived from
the original
on 13 July 2013
. Retrieved
19 November
2013
.
- ^
a
b
Cami, J.; Bernard-Salas, J.; Peeters, E.; Malek, S. E. (22 July 2010). "Detection of C60 and C70 in a Young Planetary Nebula".
Science
.
329
(5996): 1180?1182.
Bibcode
:
2010Sci...329.1180C
.
doi
:
10.1126/science.1192035
.
PMID
20651118
.
S2CID
33588270
.
- ^
Johansson, LE; Andersson, C; Ellder, J; Friberg, P; Hjalmarson, A; Hoglund, B; Irvine, WM; Olofsson, H; Rydbeck, G (1984). "Spectral scan of Orion A and IRC+10216 from 72 to 91 GHz".
Astronomy and Astrophysics
.
130
: 227?56.
Bibcode
:
1984A&A...130..227J
.
PMID
11541988
.
- ^
Millar, TJ; DA Williams (1993).
Dust and chemistry in astronomy
. Bristol [u.a.]: Inst. of Physics. p. 116.
ISBN
0-7503-0271-2
.
- ^
"Hubble Pinpoints Furthest Protocluster of Galaxies Ever Seen"
.
ESA/Hubble Press Release
. Retrieved
13 January
2012
.
- ^
Haynes, Martha.
"Hubble's Law"
. Cornell University
. Retrieved
26 November
2013
.
- ^
Huchra, John.
"Extragalactic Redshifts"
. California Institute of Technology
. Retrieved
26 November
2013
.
- ^
Ellis, Richard S.; McLure, Ross J.; Dunlop, James S.; Robertson, Brant E.; Ono, Yoshiaki; Schenker, Matthew A.; Koekemoer, Anton; Bowler, Rebecca A. A.; Ouchi, Masami; Rogers, Alexander B.; Curtis-Lake, Emma; Schneider, Evan; Charlot, Stephane; Stark, Daniel P.; Furlanetto, Steven R.; Cirasuolo, Michele (20 January 2013). "The Abundance of Star-Forming Galaxies in the Redshift Range 8.5-12: New Results from the 2012 Hubble Ultra Deep Field Campaign".
The Astrophysical Journal
.
763
(1): L7.
arXiv
:
1211.6804
.
Bibcode
:
2013ApJ...763L...7E
.
doi
:
10.1088/2041-8205/763/1/L7
.
S2CID
17883532
.
- ^
"Hubble census finds galaxies at redshifts 9 to 12"
. NASA/ESA
. Retrieved
26 November
2013
.
- ^
"Planck reveals an almost perfect universe"
.
ESA
. 21 March 2013
. Retrieved
26 November
2013
.
- ^
"Peculiar Velocity"
. Swinburne University of Technology
. Retrieved
26 November
2013
.
- ^
Yasuda, Naoki; Fukugita, Masataka; Okamura, Sadanori (February 1997).
"Study of the Virgo Cluster Using the B?Band Tully?Fisher Relation"
.
The Astrophysical Journal Supplement Series
.
108
(2): 417?448.
Bibcode
:
1997ApJS..108..417Y
.
doi
:
10.1086/312960
.
- ^
a
b
"Types of Binary Stars"
.
Australia Telescope Outreach and Education
. Australia Telescope National Facility. Archived from
the original
on 8 December 2013
. Retrieved
26 November
2013
.
- ^
a
b
Gray, Richard O.; Christopher J. Corbally (2009).
Stellar spectral classification
. Princeton, N.J.: Princeton University Press. pp. 507?513.
ISBN
978-0-691-12510-7
.
- ^
Goody, Richard M.; Yung, Yuk Ling (1989).
Atmospheric Radiation: Theoretical Basis
. New York, New York, USA: Oxford University Press.
ISBN
0-19-505134-3
.
- ^
Tessenyi, M.; Tinetti, G.; Savini, G.; Pascale, E. (November 2013). "Molecular detectability in exoplanetary emission spectra".
Icarus
.
226
(2): 1654?1672.
arXiv
:
1308.4986
.
Bibcode
:
2013Icar..226.1654T
.
doi
:
10.1016/j.icarus.2013.08.022
.
- ^
Bus, S (July 2002). "Phase II of the Small Main-Belt Asteroid Spectroscopic Survey A Feature-Based Taxonomy".
Icarus
.
158
(1): 146?177.
Bibcode
:
2002Icar..158..146B
.
doi
:
10.1006/icar.2002.6856
.
S2CID
4880578
.
- ^
Chapman, Clark R.; Morrison, David; Zellner, Ben (May 1975). "Surface properties of asteroids: A synthesis of polarimetry, radiometry, and spectrophotometry".
Icarus
.
25
(1): 104?130.
Bibcode
:
1975Icar...25..104C
.
doi
:
10.1016/0019-1035(75)90191-8
.
- ^
Sekanina, Zdenek; Kracht, Rainer (3 Jun 2015). "Disintegration of Comet C/2012 S1 (ISON) Shortly Before Perihelion: Evidence From Independent Data Sets".
arXiv
:
1404.5968v6
[
astro-ph.EP
].
- ^
Knight, Matthew.
"Why does ISON look green?"
. Comet ISON Observing Campaign. Archived from
the original
on 3 December 2013
. Retrieved
26 November
2013
.
- ^
Lisse, C. M.; Dennerl, K.; Englhauser, J.; Harden, M.; Marshall, F. E.; Mumma, M. J.; Petre, R.; Pye, J. P.; Ricketts, M. J.; Schmitt, J.; Trumper, J.; West, R. G. (11 October 1996).
"Discovery of X-ray and Extreme Ultraviolet Emission from Comet C/Hyakutake 1996 B2"
.
Science
.
274
(5285): 205?209.
Bibcode
:
1996Sci...274..205L
.
doi
:
10.1126/science.274.5285.205
.
S2CID
122700701
.
|
|---|
| Vibrational (IR)
| |
|---|
| UV?Vis?NIR "Optical"
| |
|---|
| X-ray and Gamma ray
| |
|---|
| Electron
| |
|---|
| Nucleon
| |
|---|
| Radiowave
| |
|---|
| Others
| | Data collection, processing
| |
|---|
| Measured phenomena
| |
|---|
| Applications
| |
|---|
|
|---|
|