From Wikipedia, the free encyclopedia
2003 Dutch general election
|
|
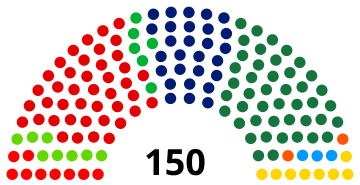
All 150 seats in the
House of Representatives
76 seats needed for a majority
|
| Turnout
| 80.0% (
 0.6
pp
) 0.6
pp
)
|
|---|
|
This lists parties that won seats. See the complete results below.
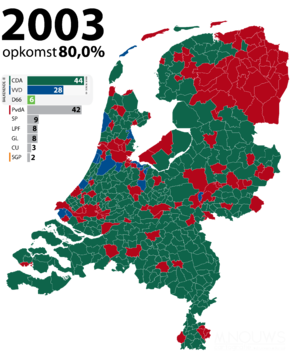 Most voted-for party by municipality
|
|
General elections were held in the
Netherlands
on 22 January 2003.
[1]
Background
[
edit
]
The election was held following the resignation of the
first Balkenende cabinet
on 16 October 2002 after conflicts attributed to the
LPF
, the new party of the already deceased
Pim Fortuyn
.
In the early days of the campaign the
CDA
of incumbent
prime minister
Jan Peter Balkenende
and the
VVD
, the smallest
coalition
party
, saw a major lead.
After TV debates the
PvdA
(which had experienced a landslide defeat in the 2002 general election) of
opposition
leader
Wouter Bos
caught up, overtaking the VVD and regaining some of the territory lost in the previous election. The PvdA also held a
leadership election
which got the party considerable attention.
Results
[
edit
]
The LPF lost as spectacularly as it won in 2002, with its seat count dropping from 26 to 8. Commentators attributed the result to voters feeling that the LPF had become rudderless without its original leader and that the government had already implemented some of its policies, but argued disaffected LPF supporters would still back an "anti-establishment" party if a viable option was available.
The exciting race of which party would become the largest was eventually won by the CDA, which went from 43 to 44 seats, ensuring a continuation of Balkenende's career as prime minister.
Most of the smaller parties on both the left and right side did not experience significant changes. Several other parties (among them
Leefbaar Nederland
, a 2002 newcomer) didn't manage to get over the threshold and thus gained no seats. They are not listed here.
After severe disagreements had frustrated the formation of a CDA-PvdA cabinet, a CDA-VVD-D66 cabinet was formed on 27 May 2003, with Balkenende as prime minister.
 |
|---|
| Party
| Votes
| %
| Seats
| +/?
|
|---|
| Christian Democratic Appeal
| 2,763,480
| 28.62
| 44
| +1
|
| Labour Party
| 2,631,363
| 27.26
| 42
| +19
|
| People's Party for Freedom and Democracy
| 1,728,707
| 17.91
| 28
| +4
|
| Socialist Party
| 609,723
| 6.32
| 9
| 0
|
| Pim Fortuyn List
| 549,975
| 5.70
| 8
| ?18
|
| GroenLinks
| 495,802
| 5.14
| 8
| ?2
|
| Democrats 66
| 393,333
| 4.07
| 6
| ?1
|
| Christian Union
| 204,694
| 2.12
| 3
| ?1
|
| Reformed Political Party
| 150,305
| 1.56
| 2
| 0
|
| Party for the Animals
| 47,754
| 0.49
| 0
| New
|
| Livable Netherlands
| 38,894
| 0.40
| 0
| ?2
|
| Party of the Future
| 13,845
| 0.14
| 0
| 0
|
| Ratelband List
| 9,045
| 0.09
| 0
| New
|
| Durable Netherlands
| 7,271
| 0.08
| 0
| 0
|
| New Communist Party of the Netherlands
| 4,854
| 0.05
| 0
| New
|
| DeConservatieven.nl
| 2,521
| 0.03
| 0
| New
|
| Progressive Integration Party
| 1,623
| 0.02
| 0
| New
|
| Alliance for Renewal and Democracy
| 990
| 0.01
| 0
| New
|
| Veldhoen List
| 296
| 0.00
| 0
| New
|
| Total
| 9,654,475
| 100.00
| 150
| 0
|
|
| Valid votes
| 9,654,475
| 99.87
| |
|---|
| Invalid/blank votes
| 12,127
| 0.13
| |
|---|
| Total votes
| 9,666,602
| 100.00
| |
|---|
| Registered voters/turnout
| 12,076,711
| 80.04
| |
|---|
| Source:
Kiesraad
|
By province
[
edit
]
Further reading
[
edit
]
References
[
edit
]
