From Wikipedia, the free encyclopedia
15th US national census
Fifteenth census
of the United States
|
|---|
|
 U.S. Census Bureau seal
|
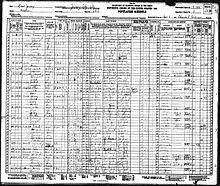 Population schedule
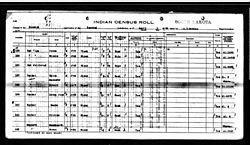 Indian census roll
|
|
| Country
| United States
|
|---|
|
| Total population
| 122,775,046 (
 13.7%) 13.7%)
|
|---|
| Most
populous
state
| New York
12,588,066
|
|---|
| Least
populous
state
| Nevada
91,058
|
|---|
The
1930 United States census
, conducted by the
Census Bureau
one month from April 1, 1930, determined the resident population of the
United States
to be 122,775,046, an increase of 13.7 percent over the 106,021,537 persons
enumerated
during the
1920 census
.
It was the first time the effects of
suburban sprawl
were recorded when, during the
Roaring Twenties
, a significant portion of the working population of
New York City
moved to
New Jersey
, aided by the
George Washington Bridge
which permitted quick transport from the state to
Manhattan
.
Census questions
[
edit
]
The 1930 census collected the following information:
[1]
- address
- name
- relationship to head of family
- home owned or rented
- if owned, value of home
- if rented, monthly rent
- whether owned a radio set
- whether on a farm
- sex
- race
- age
- marital status and, if married, age at first marriage
- school attendance
- literacy
- birthplace of person, and their parents
- if foreign born:
- language spoken at home before coming to the U. S.
- year of immigration
- whether naturalized
- ability to speak English
- occupation, industry and class of worker
- whether at work previous day (or last regular work day)
- veteran status
- if Indian:
- whether of full or mixed blood
- tribal affiliation
Full documentation for the 1930 census, including census forms and enumerator instructions, is available from the
Integrated Public Use Microdata Series
.
Data availability
[
edit
]
The original census enumeration sheets were
microfilmed
by the Census Bureau in 1949, after which the original sheets were destroyed.
[2]
The microfilmed census is located on 2,667 rolls of microfilm, and available from the
National Archives and Records Administration
. Several organizations also host images of the microfilmed census online, and digital indices.
Microdata
from the 1930 census are freely available through the
Integrated Public Use Microdata Series
.
Aggregate data
for small areas, together with electronic boundary files, can be downloaded from the
National Historical Geographic Information System
.
State rankings
[
edit
]
| Rank
|
State
|
Population as of
1930 census
[3]
|
Population as of
1920 census
|
Change
|
Percent
change
|
| 1
|
 New York
|
12,588,066
|
10,385,227
|
2,202,839
|
21.2%
|
| 2
|
 Pennsylvania
|
9,631,350
|
8,720,017
|
911,333
|
10.5%
|
| 3
|
 Illinois
|
7,630,654
|
6,485,280
|
1,145,374
|
17.7%
|
| 4
|
 Ohio
Ohio
|
6,646,697
|
5,759,394
|
887,303
|
15.4%
|
| 5
|
 Texas
Texas
|
5,824,715
|
4,663,228
|
1,161,487
|
24.9%
|
| 6
|
 California
|
5,677,251
|
3,426,861
|
2,250,390
|
65.7%
|
| 7
|
 Michigan
|
4,842,325
|
3,668,412
|
1,173,913
|
32.0%
|
| 8
|
 Massachusetts
|
4,249,614
|
3,852,356
|
397,258
|
10.3%
|
| 9
|
 New Jersey
|
4,041,334
|
3,155,900
|
885,434
|
28.1%
|
| 10
|
 Missouri
|
3,629,367
|
3,404,055
|
225,312
|
6.6%
|
| 11
|
 Indiana
|
3,238,503
|
2,930,390
|
308,113
|
10.5%
|
| 12
|
 North Carolina
|
3,170,276
|
2,559,123
|
611,153
|
23.9%
|
| 13
|
 Wisconsin
|
2,939,006
|
2,632,067
|
306,939
|
11.7%
|
| 14
|
 Georgia
|
2,908,506
|
2,895,832
|
12,674
|
0.4%
|
| 15
|
 Alabama
|
2,646,248
|
2,348,174
|
298,074
|
12.7%
|
| 16
|
 Tennessee
|
2,616,556
|
2,337,885
|
278,671
|
11.9%
|
| 17
|
 Kentucky
|
2,614,589
|
2,416,630
|
197,959
|
8.2%
|
| 18
|
 Minnesota
|
2,563,953
|
2,387,125
|
176,828
|
7.4%
|
| 19
|
 Iowa
Iowa
|
2,470,939
|
2,404,021
|
66,918
|
2.8%
|
| 20
|
 Virginia
|
2,421,851
|
2,309,187
|
112,664
|
4.9%
|
| 21
|
 Oklahoma
|
2,396,040
|
2,028,283
|
367,757
|
18.1%
|
| 22
|
 Louisiana
|
2,101,593
|
1,798,509
|
303,084
|
16.9%
|
| 23
|
 Mississippi
|
2,009,821
|
1,790,618
|
219,203
|
12.2%
|
| 24
|
 Kansas
|
1,880,999
|
1,769,257
|
111,742
|
6.3%
|
| 25
|
 Arkansas
|
1,854,482
|
1,752,204
|
102,278
|
5.8%
|
| 26
|
 South Carolina
|
1,738,765
|
1,683,724
|
55,041
|
3.3%
|
| 27
|
 West Virginia
|
1,729,205
|
1,463,701
|
265,504
|
18.1%
|
| 28
|
 Maryland
|
1,631,526
|
1,449,661
|
181,865
|
12.5%
|
| 29
|
 Connecticut
|
1,606,903
|
1,380,631
|
226,272
|
16.4%
|
| 30
|
 Washington
|
1,563,396
|
1,356,621
|
206,775
|
15.2%
|
| 31
|
 Florida
|
1,468,211
|
968,470
|
499,741
|
51.6%
|
| 32
|
 Nebraska
|
1,377,963
|
1,296,372
|
81,591
|
6.3%
|
| 33
|
 Colorado
|
1,035,791
|
939,629
|
96,162
|
10.2%
|
| 34
|
 Oregon
|
953,786
|
783,389
|
170,397
|
21.8%
|
| 35
|
 Maine
Maine
|
797,423
|
768,014
|
29,409
|
3.8%
|
| 36
|
 South Dakota
|
692,849
|
636,547
|
56,302
|
8.8%
|
| 37
|
 Rhode Island
|
687,497
|
604,397
|
83,100
|
13.7%
|
| 38
|
 North Dakota
|
680,845
|
646,872
|
33,973
|
5.3%
|
| 39
|
 Montana
|
537,606
|
548,889
|
-11,283

|
-2.1%
|
| 40
|
 Utah
Utah
|
507,847
|
449,396
|
58,451
|
13.0%
|
| –
|
 District of Columbia
|
486,869
|
437,571
|
49,298
|
11.3%
|
| 41
|
 New Hampshire
|
465,293
|
443,083
|
22,210
|
5.0%
|
| 42
|
 Idaho
Idaho
|
445,032
|
431,866
|
13,166
|
3.0%
|
| 43
|
 Arizona
|
435,573
|
334,162
|
101,411
|
30.3%
|
| 44
|
 New Mexico
|
423,317
|
360,350
|
62,967
|
17.5%
|
| –
|
 Hawaii
|
368,300
|
255,881
|
112,419
|
43.9%
|
| 45
|
 Vermont
|
359,611
|
352,428
|
7,183
|
2.0%
|
| 46
|
 Delaware
|
238,380
|
223,003
|
15,377
|
6.9%
|
| 47
|
 Wyoming
|
225,565
|
194,402
|
31,163
|
16.0%
|
| 48
|
 Nevada
|
91,058
|
77,407
|
13,651
|
17.6%
|
| –
|
 Alaska
|
59,278
|
55,036
|
4,242
|
7.7%
|
City rankings
[
edit
]
| Rank
|
City
|
State
|
Population
[4]
|
Region (2016)
[5]
|
| 01
|
New York
|
New York
|
6,930,446
|
Northeast
|
| 02
|
Chicago
|
Illinois
|
3,376,438
|
Midwest
|
| 03
|
Philadelphia
|
Pennsylvania
|
1,950,961
|
Northeast
|
| 04
|
Detroit
|
Michigan
|
1,568,662
|
Midwest
|
| 05
|
Los Angeles
|
California
|
1,238,048
|
West
|
| 06
|
Cleveland
|
Ohio
|
900,429
|
Midwest
|
| 07
|
St. Louis
|
Missouri
|
821,960
|
Midwest
|
| 08
|
Baltimore
|
Maryland
|
804,874
|
South
|
| 09
|
Boston
|
Massachusetts
|
781,188
|
Northeast
|
| 10
|
Pittsburgh
|
Pennsylvania
|
669,817
|
Northeast
|
| 11
|
San Francisco
|
California
|
634,394
|
West
|
| 12
|
Milwaukee
|
Wisconsin
|
578,249
|
Midwest
|
| 13
|
Buffalo
|
New York
|
573,076
|
Northeast
|
| 14
|
Washington
|
District of Columbia
|
486,869
|
South
|
| 15
|
Minneapolis
|
Minnesota
|
464,356
|
Midwest
|
| 16
|
New Orleans
|
Louisiana
|
458,762
|
South
|
| 17
|
Cincinnati
|
Ohio
|
451,160
|
Midwest
|
| 18
|
Newark
|
New Jersey
|
442,337
|
Northeast
|
| 19
|
Kansas City
|
Missouri
|
399,746
|
Midwest
|
| 20
|
Seattle
|
Washington
|
365,583
|
West
|
| 21
|
Indianapolis
|
Indiana
|
364,161
|
Midwest
|
| 22
|
Rochester
|
New York
|
328,132
|
Northeast
|
| 23
|
Jersey City
|
New Jersey
|
316,715
|
Northeast
|
| 24
|
Louisville
|
Kentucky
|
307,745
|
South
|
| 25
|
Portland
|
Oregon
|
301,815
|
West
|
| 26
|
Houston
|
Texas
|
292,352
|
South
|
| 27
|
Toledo
|
Ohio
|
290,718
|
Midwest
|
| 28
|
Columbus
|
Ohio
|
290,564
|
Midwest
|
| 29
|
Denver
|
Colorado
|
287,861
|
West
|
| 30
|
Oakland
|
California
|
284,063
|
West
|
| 31
|
Saint Paul
|
Minnesota
|
271,606
|
Midwest
|
| 32
|
Atlanta
|
Georgia
|
270,366
|
South
|
| 33
|
Dallas
|
Texas
|
260,475
|
South
|
| 34
|
Birmingham
|
Alabama
|
259,678
|
South
|
| 35
|
Akron
|
Ohio
|
255,040
|
Midwest
|
| 36
|
Memphis
|
Tennessee
|
253,143
|
South
|
| 37
|
Providence
|
Rhode Island
|
252,981
|
Northeast
|
| 38
|
San Antonio
|
Texas
|
231,542
|
South
|
| 39
|
Omaha
|
Nebraska
|
214,006
|
Midwest
|
| 40
|
Syracuse
|
New York
|
209,326
|
Northeast
|
| 41
|
Dayton
|
Ohio
|
200,982
|
Midwest
|
| 42
|
Worcester
|
Massachusetts
|
195,311
|
Northeast
|
| 43
|
Oklahoma City
|
Oklahoma
|
185,389
|
South
|
| 44
|
Richmond
|
Virginia
|
182,929
|
South
|
| 45
|
Youngstown
|
Ohio
|
170,002
|
Midwest
|
| 46
|
Grand Rapids
|
Michigan
|
168,592
|
Midwest
|
| 47
|
Hartford
|
Connecticut
|
164,072
|
Northeast
|
| 48
|
Fort Worth
|
Texas
|
163,447
|
South
|
| 49
|
New Haven
|
Connecticut
|
162,655
|
Northeast
|
| 50
|
Flint
|
Michigan
|
156,492
|
Midwest
|
| 51
|
Nashville
|
Tennessee
|
153,866
|
South
|
| 52
|
Springfield
|
Massachusetts
|
149,900
|
Northeast
|
| 53
|
San Diego
|
California
|
147,995
|
West
|
| 54
|
Bridgeport
|
Connecticut
|
146,716
|
Northeast
|
| 55
|
Scranton
|
Pennsylvania
|
143,433
|
Northeast
|
| 56
|
Des Moines
|
Iowa
|
142,559
|
Midwest
|
| 57
|
Long Beach
|
California
|
142,032
|
West
|
| 58
|
Tulsa
|
Oklahoma
|
141,258
|
South
|
| 59
|
Salt Lake City
|
Utah
|
140,267
|
West
|
| 60
|
Paterson
|
New Jersey
|
138,513
|
Northeast
|
| 61
|
Yonkers
|
New York
|
134,646
|
Northeast
|
| 62
|
Norfolk
|
Virginia
|
129,710
|
South
|
| 63
|
Jacksonville
|
Florida
|
129,549
|
South
|
| 64
|
Albany
|
New York
|
127,412
|
Northeast
|
| 65
|
Trenton
|
New Jersey
|
123,356
|
Northeast
|
| 66
|
Kansas City
|
Kansas
|
121,857
|
Midwest
|
| 67
|
Chattanooga
|
Tennessee
|
119,798
|
South
|
| 68
|
Camden
|
New Jersey
|
118,700
|
Northeast
|
| 69
|
Erie
|
Pennsylvania
|
115,967
|
Northeast
|
| 70
|
Spokane
|
Washington
|
115,514
|
West
|
| 71
|
Fall River
|
Massachusetts
|
115,274
|
Northeast
|
| 72
|
Fort Wayne
|
Indiana
|
114,946
|
Midwest
|
| 73
|
Elizabeth
|
New Jersey
|
114,589
|
Northeast
|
| 74
|
Cambridge
|
Massachusetts
|
113,643
|
Northeast
|
| 75
|
New Bedford
|
Massachusetts
|
112,597
|
Northeast
|
| 76
|
Reading
|
Pennsylvania
|
111,171
|
Northeast
|
| 77
|
Wichita
|
Kansas
|
111,110
|
Midwest
|
| 78
|
Miami
|
Florida
|
110,637
|
South
|
| 79
|
Tacoma
|
Washington
|
106,817
|
West
|
| 80
|
Wilmington
|
Delaware
|
106,597
|
South
|
| 81
|
Knoxville
|
Tennessee
|
105,802
|
South
|
| 82
|
Peoria
|
Illinois
|
104,969
|
Midwest
|
| 83
|
Canton
|
Ohio
|
104,906
|
Midwest
|
| 84
|
South Bend
|
Indiana
|
104,193
|
Midwest
|
| 85
|
Somerville
|
Massachusetts
|
103,908
|
Northeast
|
| 86
|
El Paso
|
Texas
|
102,421
|
South
|
| 87
|
Lynn
|
Massachusetts
|
102,320
|
Northeast
|
| 88
|
Evansville
|
Indiana
|
102,249
|
Midwest
|
| 89
|
Utica
|
New York
|
101,740
|
Northeast
|
| 90
|
Duluth
|
Minnesota
|
101,463
|
Midwest
|
| 91
|
Tampa
|
Florida
|
101,161
|
South
|
| 92
|
Gary
|
Indiana
|
100,426
|
Midwest
|
| 93
|
Lowell
|
Massachusetts
|
100,234
|
Northeast
|
| 94
|
Waterbury
|
Connecticut
|
99,902
|
Northeast
|
| 95
|
Schenectady
|
New York
|
95,692
|
Northeast
|
| 96
|
Sacramento
|
California
|
93,750
|
West
|
| 97
|
Allentown
|
Pennsylvania
|
92,563
|
Northeast
|
| 98
|
Bayonne
|
New Jersey
|
88,979
|
Northeast
|
| 99
|
Wilkes-Barre
|
Pennsylvania
|
86,626
|
Northeast
|
| 100
|
Rockford
|
Illinois
|
85,864
|
Midwest
|
Locations of 50 most populous cities
[
edit
]
Location of 50 largest cities by population in the United States in 1930. Not shown:
Manila
,
Philippines
.
Notes
[
edit
]
- ^
"Library Bibliography Bulletin 88, New York State Census Records, 1790?1925"
.
New York State Library
. October 1981. p. 45 (p. 51 of PDF).
Archived
from the original on January 30, 2009
. Retrieved
December 15,
2008
.
- ^
The United States National Archives and Records Administration.
"FAQs about the 1930 Census"
.
National Archives website
. Retrieved
May 17,
2012
.
- ^
"1930 Census: Volume 1. Population, Number and Distribution of Inhabitants"
. United States Census Bureau.
Archived
from the original on May 26, 2017
. Retrieved
August 5,
2021
.
- ^
Population of the 100 Largest Cities and Other Urban Places in the United States: 1790 to 1990
, U.S. Census Bureau, 1998
- ^
"Regions and Divisions"
. U.S. Census Bureau. Archived from
the original
on December 3, 2016
. Retrieved
September 9,
2016
.
External links
[
edit
]
