From Wikipedia, the free encyclopedia
1898 German federal election
|
|
|
| Registered
| 11,441,054
 7.65% 7.65%
|
|---|
| Turnout
| 7,786,714 (68.06%)
 4.41
pp 4.41
pp
|
|---|
|
|
First party
|
Second party
|
Third party
|
|
|

|

|

|
| Leader
|
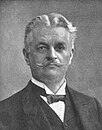
Franz von Ballestrem
|
Paul Singer
&
August Bebel
|
Otto von Manteuffel
|
| Party
|
Centre
|
SPD
|
DKP
|
| Last election
|
19.14%, 96 seats
|
23.28%, 44 seats
|
12.93%, 69 seats
|
| Seats won
|
102
|
56
|
53
|
| Seat change
|
6
|
12
|
16
|
| Popular vote
|
1,454,042
|
2,107,076
|
830,341
|
| Percentage
|
18.76%
|
27.18%
|
10.71%
|
| Swing
|
0.38pp
|
3.90pp
|
2.22pp
|
|
|
|
Fourth party
|
Fifth party
|
Sixth party
|
|
|
|

|
DRP
|
| Leader
|
Ernst Bassermann
[
de
]
|
Eugen Richter
|
|
| Party
|
NlP
|
FVP
|
DRP
|
| Last election
|
12.29%, 51 seats
|
8.67%, 24 seats
|
5.71%, 28 seats
|
| Seats won
|
48
|
29
|
22
|
| Seat change
|
3
|
5
|
6
|
| Popular vote
|
997,147
|
558,314
|
337,601
|
| Percentage
|
12.86%
|
7.20%
|
4.35%
|
| Swing
|
0.57pp
|
1.47pp
|
1.36pp
|
|
 Map of results (by constituencies)
|
|
Federal elections
were held in
Germany
on 16 June 1898.
[1]
Despite the
Social Democratic Party
(SPD) receiving the most votes, the
Centre Party
remained the largest party in the
Reichstag
after winning 102 of the 397 seats, whilst the SPD won just 56.
[2]
Voter turnout was 68%.
[3]
Results
[
edit
]
|
|---|
| Party
| Votes
| %
| +/?
| Seats
| +/?
|
|---|
| Social Democratic Party
| 2,107,076
| 27.18
| +3.90
| 56
| +12
|
| Centre Party
| 1,454,042
| 18.76
| ?0.38
| 102
| +6
|
| National Liberal Party
| 997,147
| 12.86
| +0.57
| 48
| ?3
|
| German Conservative Party
| 830,341
| 10.71
| ?2.22
| 53
| ?16
|
| Free-minded People's Party
| 558,314
| 7.20
| ?1.47
| 29
| +5
|
| German Reich Party
| 337,601
| 4.35
| ?1.36
| 22
| ?6
|
| Social Reform Party
| 215,891
| 2.78
| ?0.51
| 10
| ?6
|
| Free-minded Union
| 195,682
| 2.52
| ?0.87
| 12
| ?1
|
| Independent Polish
| 169,037
| 2.18
| ?0.07
| 8
| ?6
|
| Bavarian Peasants' League
| 130,724
| 1.69
| +1.13
| 4
| +2
|
| Alsace-Lorraine parties
| 118,072
| 1.52
| ?0.25
| 11
| +2
|
| German People's Party
| 106,396
| 1.37
| ?0.80
| 8
| ?3
|
| German-Hanoverian Party
| 105,161
| 1.36
| +0.03
| 9
| +2
|
| German Agrarian League
| 103,489
| 1.33
| New
| 6
| New
|
| Christian Social Party
| 48,914
| 0.63
| ?0.61
| 1
| ?1
|
| Polish Court Party
| 67,424
| 0.87
| +0.17
| 6
| +1
|
| Independent liberals
| 46,731
| 0.60
| ?0.13
| 3
| +1
|
| Independent conservatives
| 28,846
| 0.37
| ?0.10
| 3
| +1
|
| National-Social Group
| 27,208
| 0.35
| New
| 0
| New
|
| Independent anti-semites
| 22,989
| 0.30
| +0.15
| 2
| +2
|
| Alsatian liberals
| 16,887
| 0.22
| +0.14
| 1
| 0
|
| Danish Party
| 15,439
| 0.20
| +0.01
| 1
| 0
|
| Other agrarians
| 9,019
| 0.12
| ?0.22
| 1
| 0
|
| Lithuanian Party
| 8,142
| 0.11
| +0.06
| 1
| +1
|
| Polish People's Party
| 7,667
| 0.10
| New
| 0
| New
|
| Other conservatives
| 4,473
| 0.06
| ?0.19
| 0
| ?1
|
| Middle Class parties
| 3,162
| 0.04
| New
| 0
| New
|
| Alsace Liberal Group
| 2,132
| 0.03
| New
| 0
| New
|
| Others
| 14,075
| 0.18
| 0.00
| 0
| 0
|
| Unknown
| 612
| 0.01
| +0.01
| 0
| 0
|
| Total
| 7,752,693
| 100.00
| ?
| 397
| 0
|
|
| Valid votes
| 7,752,693
| 99.56
| |
|---|
| Invalid/blank votes
| 34,021
| 0.44
| |
|---|
| Total votes
| 7,786,714
| 100.00
| |
|---|
| Registered voters/turnout
| 11,441,054
| 68.06
| |
|---|
| Source:
Wahlen in Deutschland
|
Alsace-Lorraine
[
edit
]
| Party
| Votes
| %
| +/?
| Seats
| +/?
|
|---|
| Alsace-Lorraine Land Party
| 67,171
| 29.34
| New
| 6
| New
|
| Social Democratic Party
| 51,990
| 22.71
| +3.41
| 1
| ?1
|
| Lorraine independent conservatives
| 25,658
| 11.21
| +7.07
| 3
| +2
|
| Alsatian Liberals
| 16,887
| 7.38
| +4.68
| 1
| 0
|
| Clericals
| 14,125
| 6.17
| ?30.93
| 1
| ?5
|
| Independent conservatives
| 13,483
| 5.89
| +0.16
| 1
| 0
|
| German Reich Party
| 9,381
| 4.10
| ?1.96
| 1
| 0
|
| Alsace-Lorraine protesters
| 6,237
| 2.72
| ?1.86
| 1
| 0
|
| Alsatian autonomists
| 4,881
| 2.13
| ?2.76
| 0
| 0
|
| National Liberal Party
| 8,144
| 3.56
| +0.90
| 0
| 0
|
| Independent liberals
| 6,900
| 3.01
| +1.29
| 0
| 0
|
| Alsace Liberal Group
| 2,132
| 0.93
| New
| 0
| New
|
| German Social Party
| 860
| 0.38
| ?1.04
| 0
| 0
|
| Free-minded Union
| 321
| 0.14
| New
| 0
| New
|
| Others
| 743
| 0.32
| +0.18
| 0
| 0
|
| Total
| 228,913
| 100.00
| ?
| 15
| 0
|
|
| Valid votes
| 228,913
| 97.95
| |
|---|
| Invalid/blank votes
| 4,783
| 2.05
| |
|---|
| Total votes
| 233,696
| 100.00
| |
|---|
| Registered voters/turnout
| 233,696
| 100.00
| |
|---|
| Source:
Wahlen in Deutschland
|
References
[
edit
]
