Tuesday, May 28, 2024
According to Baseball Savant, Salvador Perez has been minus 89 runs in Catcher Framing since 2016. Fangraphs has him at a similar -80 runs. Baseball Prospectus at -82 runs. DRS has a more compressed scale, still with Salvador as 2nd worst at -46 runs (compared to the low of -48 runs).
So, it is clear, Salvador Perez is a disaster at Pitch Presentation. And his other skills, his throwing (+17 runs) and blocking (+1 run) just can't compensate for that. Overall, he's a big net negative at -72 runs. But, is that all there is to being a catcher? Surely there's more to it. The calling of the pitches, the confidence the pitcher has.
See, when we look at Pitch Presentation, that's basically a segment of the pitch. Everything else that goes into it is not considered. Maybe he is so good at everything else about being a catcher that it not only overcomes such a huge deficit, but he may in fact even be a net positive. Is that possible?
Well, let me give you a number to blow your mind. Since 2016, the Royals with Salvador Perez have given up 3079 runs while making 17,369 outs. That is a rate of 4.79 runs allowed over the equivalent of 643 9-inning games (or just about exactly 4.0 full 162 game seasons). The Royals without Salvador as catcher have played the equivalent of 3.6 full seasons, while allowing 5.28 runs per 27 outs.
In other words, the Royals, with Salvador, have given up nearly 0.5 fewer runs per 9 innings. And since we just said he played the equivalent of 643 9-inning games, that's 316 fewer runs allowed with Salvador. This stands in STARK contrast to the 72 MORE runs that Salvador allows when we consider Framing, Throwing, and Blocking. We have a 388 run gap here to bridge.
Now, you may be saying: is Salvador catching with the better pitchers maybe? Well, that's the question I ask. As you know, I pioneered the WOWY method (With or Without You), which really at its heart is a simplified mixed-effects model. WOWY has the advantage of being completely transparent, easy to explain, and with a great theme song.
Let's start with Danny Duffy. With Duffy and Salvador, the Royals gave up 152 runs on 1222 outs. With Duffy and without Salvador, the Royals gave up 178 runs on 965 outs. So, that's more runs allowed and fewer outs. This is a feather for Salvador. Pro-rating the 178 runs on 965 outs to the 1222 outs that Salvador caught, that gives us a weighted runs allowed of 225. As you can see, Duffy loves Salvador: he gave up 152 runs instead of the expected 225 runs, or 71 fewer runs.
However, repeating this process for the next most popular pitcher, Ian Kennedy, he gave up 27 more runs with Salvador than without Salvador. Brad Keller also gave up more, at 13 more runs. As did Brady Singer at 46 more runs. And Jakob Janis at 20 more runs.
The Duffy pitchers, those what gave up fewer runs with Salvador gave up a total of 721 fewer runs. The Singer/Kennedy pitchers, those that gave up more runs with Salvador than without gave up 417 more runs. Add it up, and Salvador still allowed 305 fewer runs. This is after controlling for the quality of pitchers.
Remember, we had him at 316 fewer runs allowed without any controls at all. With this level of control, the identity of the pitcher, all we did was reduce that to 305 fewer runs allowed.
Can we do more here? Yeah, we can look at it year by year. Maybe we can focus only on strikeouts and walks, or at least separate the K, BB numbers from the other numbers. We can do alot.
But, the main point here is to say that Pitch Presentation, as real as it is, and as large of an effect as it has, still may pale in comparison to everything else that a catcher does beyond Throwing and Blocking. There's Game Calling. And maybe even just an overarching skill that we can call it Presence if we want.
Whatever it is, it's important that focusing on a very specific skill in a very myopic way doesn't keep us from looking at the overall impact of the catcher.
Wednesday, May 15, 2024
As you know, I have a win expectancy chart using the inning, score differential, runners on base, and outs. That's posted online,
here
and
here
, as well as
in The Book
.
Did I ever tell you I have a win expectancy chart that ALSO include the ball-strike count? I might have, I don't remember. I rarely if ever use it. I think it's time to break it out for the Ron Washington called, batter not-executed
bases loaded squeeze play
. Wash noted it wasn't that hard a play to make, but it sure seemed incredibly hard.
Anyway, on to the data. The scenario is this. It's the bottom of the 8th, 1 out, bases loaded, Angels down by 1, with a 1-1 count. The win expectancy is .539 with a 1-1 count (it was .549 at the start of the PA).
Now, let's go thru some possibilities.
- First, what actually happened: runner is out, batter gets a strike, but both runners advance. In effect, the runner on 1B was putout. The win expectancy plummeted to .284.
- Next, what did Wash hope to happen? In that case, runner scores to tie it up, other runners advance, the batter is putout. In that case, the win expectancy jumps to .611.
- There are of course other possibilities. Batter could be safe (win expectancy goes to .774), there could have been a double-play, as we nearly saw (win expectancy goes to .158). The batter could have bunted foul (win expectancy goes to .501). I won't go thru all those scenarios, unless someone really wants to know.
Anyway, so, let's recap:
- what could have happened was: .611- .539 = +.072 wins
- what did happen was: .284 - .539 = -.255 wins
Well, that makes the breakeven point 78% under these two possibilities. Maybe it goes down to 70-75% if we consider all the ways it could have turned out. If Wash thinks that the batter had a more than 3/4 chance of pulling this off, then it's a good call. If batter had a less than a 3/4 chance of pulling this off, then it's a bad call. Notwithstanding the half-dozen other scenarios this could have played out.
Also note: I did not consider the lefty/lefty/sinkerballer note that Wash suggested, nor any quality of batter. There are of course many considerations, which is why this is a starting point to the discussion.
Friday, May 10, 2024
Theo Epstein had a great line some 15 or 20 years ago, paraphrasing: in order to see better, he needs glasses with one lens focused on performance analysis and the other lens on scouting. He needed both to see clearly.
One of the things that scouting entails (among many other things) is focused on tools: how fast someone runs, or throws, or in the case of batters, swings. (Again for you speed readers: I'm only talking about one small facet of scouting.) Most of us are focused on the end results (in the form of say wOBA), and then reverse-engineering, or inferring, what that means. Someone hits 50 HR, we infer they have a high bat speed. Someone hits 0 HR but has a .350 batting average, and we infer they have a low bat speed, but they square up the ball alot. 50 HR with 200 strikeouts and maybe they swing hard all the time. 50 HR with 50 strikeouts and maybe they swing hard and make great contact.
Instead of inferring what the batter might be doing that leads to those results, we can now use a new data point: bat speed. We no longer need to know if they swing hard or not. We now know. And by this time next year, we will know if their year to year bat speed went up or down.
For this little study, I'm going to presume that the batter's bat speed applies to his whole career (since 2015). I am going to use three data points: wOBA, xwOBA, and bat speed. I will be correlating each to next season's target, which is wOBA. It's important to note that wOBA includes walks and strikeouts.
First off, xwOBA does the best, with a correlation of r=0.446. wOBA comes next at r=0.407, while bat speed comes in last at r=0.224. On the one hand: that seems low. On the other hand: that seems high. After all, wOBA and xwOBA uses the combination of everything the batter does (his swing, his approach, his results, etc), and so, we'd expect them to correlate well with next season's wOBA. But bat speed is just... bat speed. To just be given that number, and get to an r=0.224 is actually pretty impressive.
What really matters though is if bat speed gives us EXTRA information, beyond what we already know in wOBA and xwOBA. First, when we use both wOBA and xwOBA, our correlation goes up to r=0.450. Remember, we got 0.446 with just xwOBA on its own. Including wOBA barely moves us forward. In other words, xwOBA, which focuses on launch speed and angle already does a great job in describing the batter, that we don't really need their result in the form of wOBA.
See, what happens is that xwOBA removes a layer from wOBA: it removes all the parks and fielders and Random Variation that comes with that. Most of that is really noise and so, adding wOBA to xwOBA doesn't really help us. We just needed xwOBA.
Now, what about bat speed? What if we look at xwOBA and bat speed? Well, in that case, our correlation goes to r=0.455. That is higher than xwOBA + wOBA. That's right, given the choice between xwOBA and wOBA, or between xwOBA and bat speed, it's the latter that is preferred. (Insofar that this little test suggests.)
Remember, think of it in terms of layers. One layer removed from wOBA is xwOBA. Then, one layer removed from xwOBA is bat speed. Bat speed leads to launch speed, which is the key ingredient of xwOBA. And xwOBA leads to wOBA. The more layers you peel back, the more you get to the core of the batter themselves.
And to finish off this little study: wOBA and bat speed gives us an r=0.429, which is even less than xwOBA on its own.
All three gives us an r=0.460
One word about xwOBA: it is a descriptive metric, not predictive. If I wanted to make it predictive, I would have done so. I would have given a POSITIVE weight to a high launch speed, high launch angle popout. In reality, xwOBA, a descriptive metric, gives this a very NEGATIVE value. As it should. But, as a PREDICTIVE metric, this would get a very positive value. Why? Because hitting a 100 mph, 60 degree popup takes ALOT of power. It's a sign that the batter has... high bat speed. That's the inference we can make. Of course, now that we have bat speed, we no longer need to make that inference.
Next time, I will look at see if how much a batter squares up on the ball does to predict wOBA. I don't know the answer yet.
Saturday, May 04, 2024
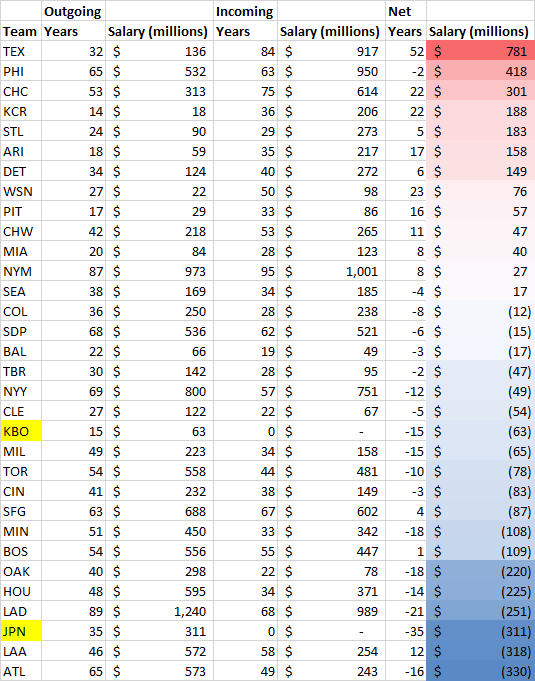
Using the sublime
Free Agency Tracker
at Fangraphs, I added up all the years and dollars that each club spent on free agency, 2020-2024. At no big surprise, the Mets led at 1.001 billion dollars, at 95 years. What I ALSO looked at is at the players they LOST to free agency, how much those players were signed by OTHER teams. The former-Mets players for example signed elsewhere for 973 million dollars, at 87 years. So, the NET in free agency for the Mets ended up at +27 million dollars and +8 years, putting them right in the middle. In other words, the Mets are basically "trading" one free agent for another free agent. I'll leave it to Aspiring Saberists to decide if these are good trades or not.
Anyway, the team that spent the most on free agents in terms of these NET dollars was the Rangers, at +781 million dollars. In 4th place, shocking to me at first, was the Royals, a net +188 million dollars. But, this had more to do with the Royals not losing any talent to free agency. The most valuable player they lost to free agency was Greinke in 2023 at 8.5 million $. At the other end, the team that LEAST relies on free agency was the Braves: they signed 243 million dollars in free agents, while they let walk 573 million $ to other teams. Incredibly to me, 3rd place was the Dodgers, who are a net negative 251 million $: they signed a ton, at 989 million, 2nd most, but they let other teams sign the most from the former players at 1.24 billion dollars.
Click to embiggen
(2)
Comments
• 2024/05/06
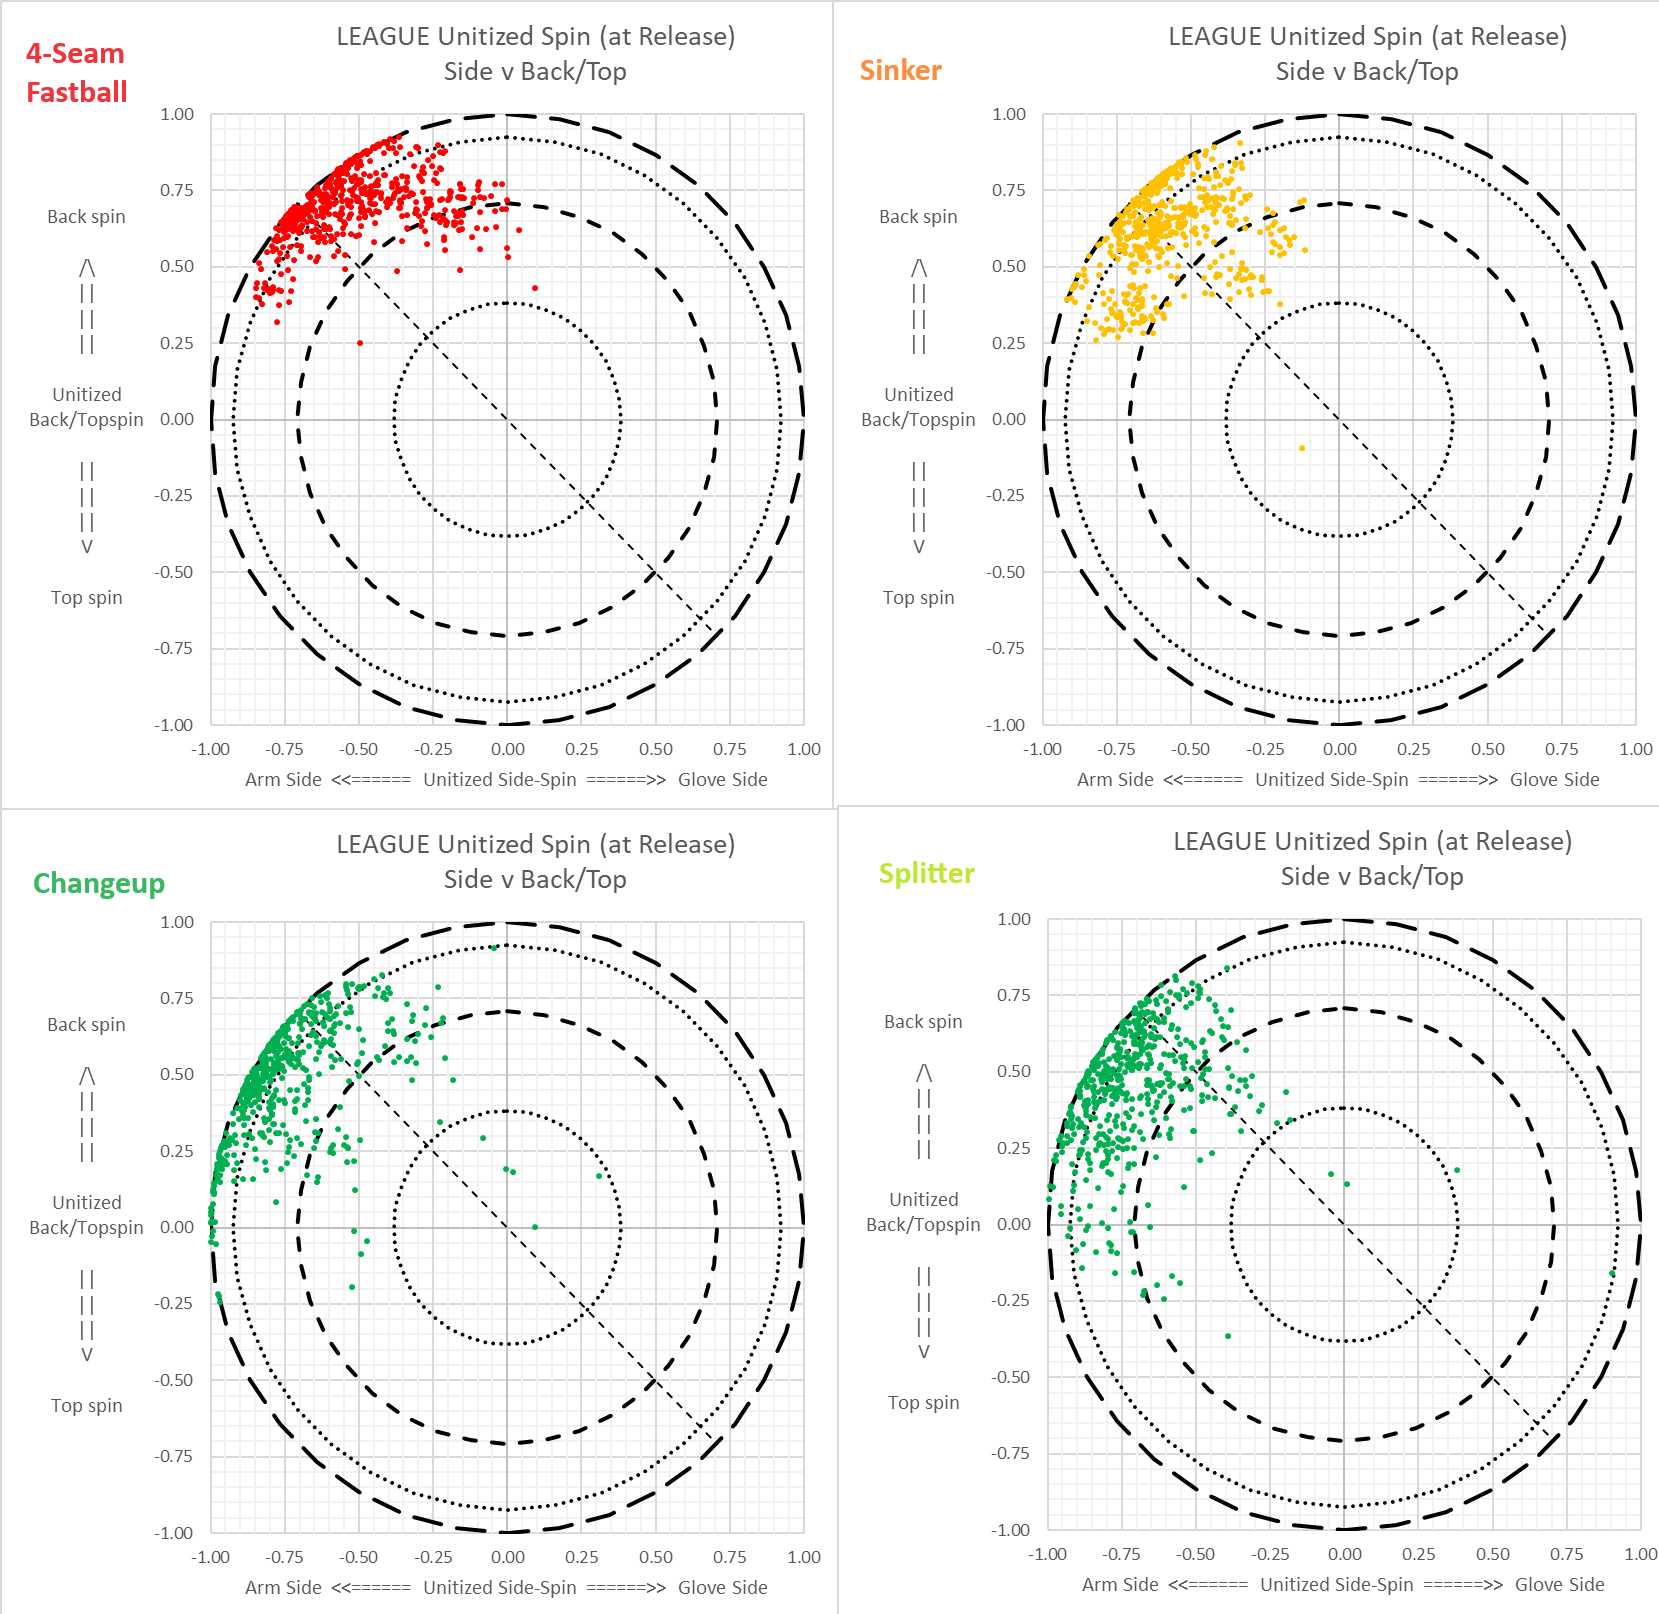
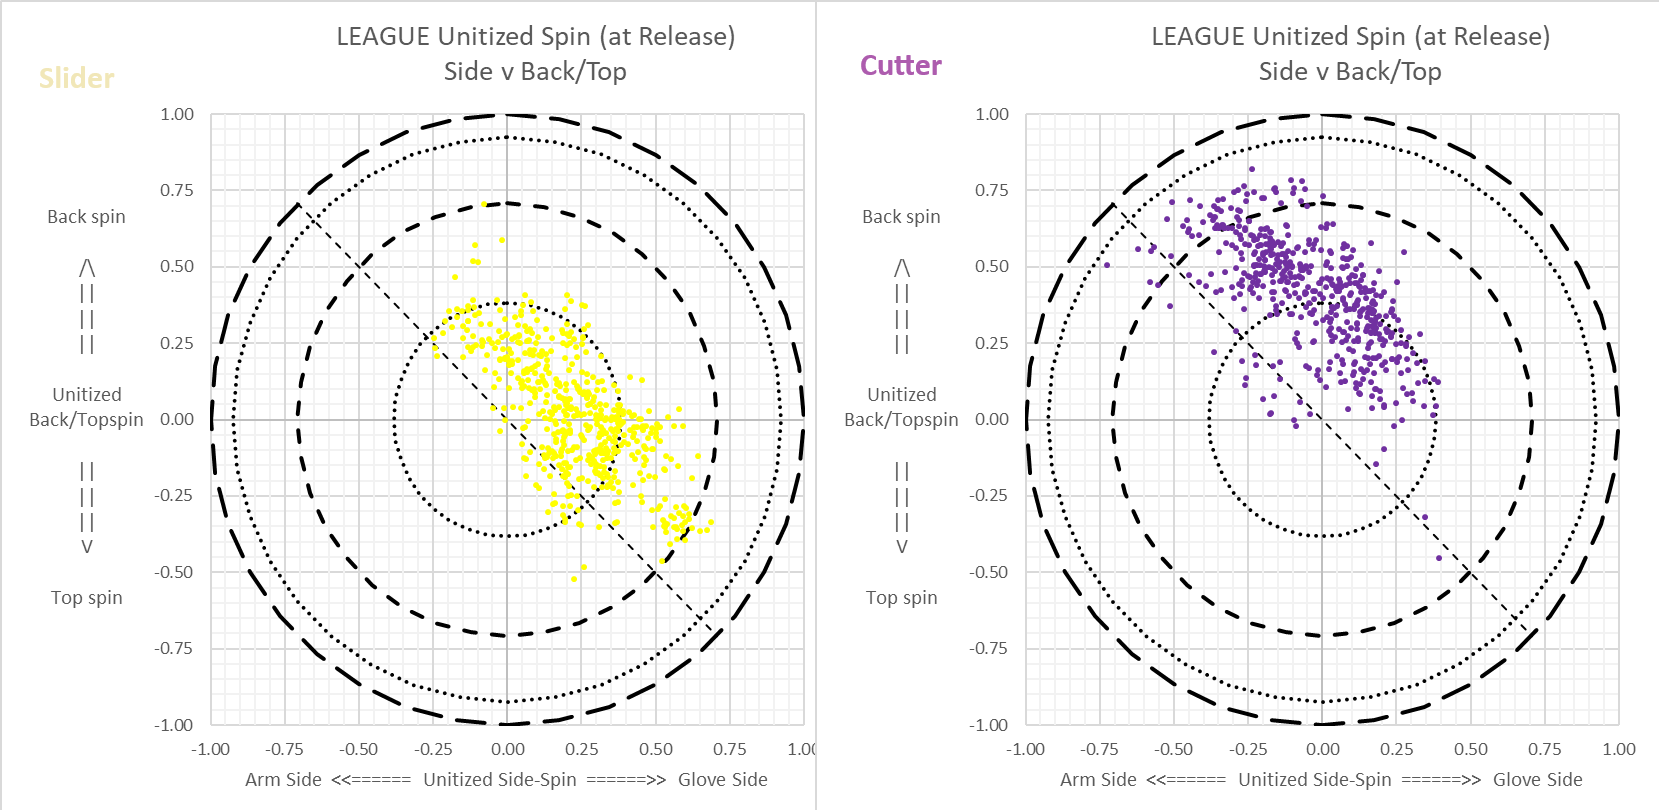
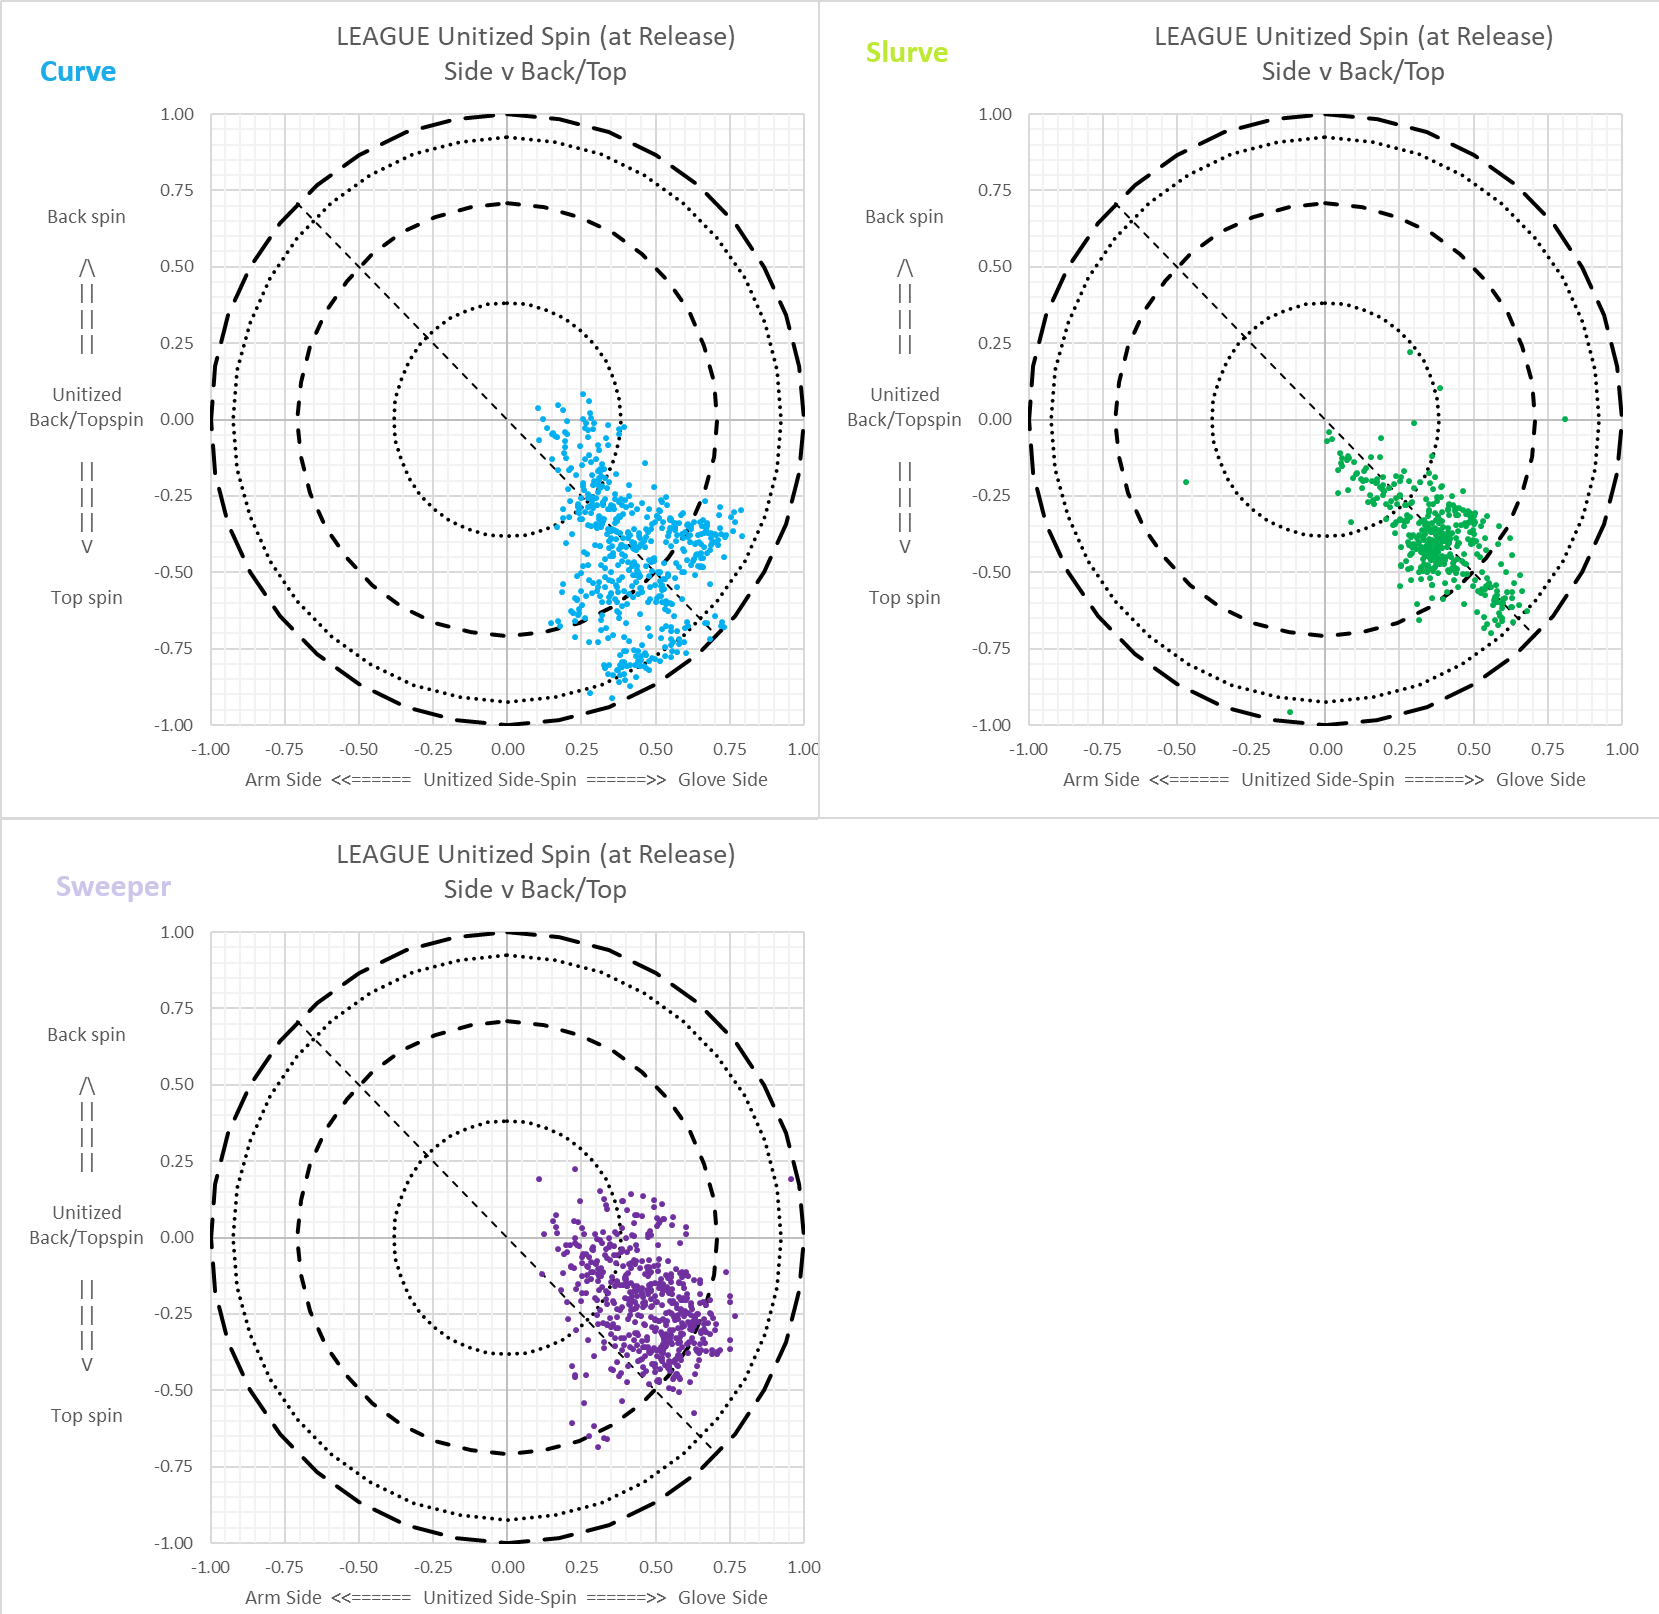
This shows it league-wide, for the last (up to) 10,000 pitches of each pitch type. Use this as a reference.
You can see how this could form the basis for an objective standard. The main reason it looks more splattered than we'd like is because if a pitcher says his pitch is a slider, but splatters more like a cutter, we still call it a slider. The good news is that at least we made headways in getting pitchers to split their sliders into gyro-slider and sweeper-slider. One day, the objective standards will eventually take hold, but that day is not yet upon us.
Click to embiggen
Wednesday, May 01, 2024
(Click to embiggen)
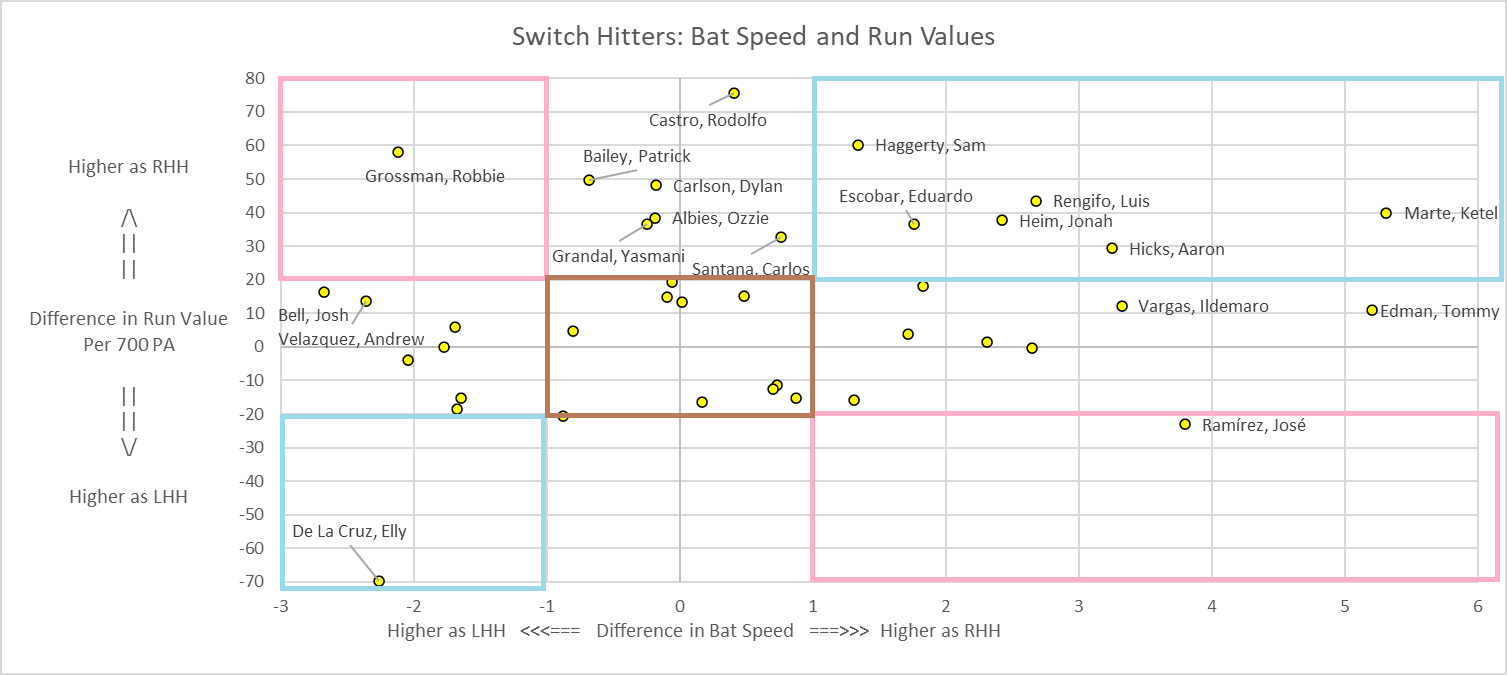
The x-axis shows the difference in swing speed for switch hitters. Players on the far right, like Jose Ramirez, swing much harder as a RHH than LHH. Players on the far left, like EDLC swing harder as a LHH than RHH.
The y-axis shows the difference in wOBA, translated to Runs per 700 PA. Players on top, like Robbie Grossman, perform much better as a RHH. Players on bottom, like EDLC perform much (much much) better as a LHH.
In the red box are players with reverse-splits: they perform batter from one side, though swing harder on the other side. As you can see, these are unusual players. Robbie Grossman hits much better as a RHH, even though he swings harder as a LHH.
In the blue box are players with matching-splits and have extreme gaps in swing speeds: EDLC for example performs far far better as a LHH. And, not coincidentally, he swings harder as a LHH. As you can see, there are many more switch hitters who perform both much better as RHH and swing harder as a RHH. The players in the blue box are candidates to stop switch hitting.
Batters in the middle across have a gap in the swing speeds, but no gap in performance. They may have figured out how to compensate their game. Tommy Edman is on the cusp here. He swings far harder as a RHH, and just has a modestly higher performance as a RHH.
Batters in the center down have a gap in performance, but no gap in swing speed. If there is a reason that Ozzie Albies performs much better as a RHH, it's not tied to his swing speed as LHH and RHH.
(7)
Comments
• 2024/05/28
•
Bat_Tracking
Rarely does baseball offer the level of managerial strategy that you'd find in football. But we got a doozy yesterday.
AJ has the setup
right here
With one out in the fifth inning of San Diego’s 6-4 victory over the Reds at Petco Park, Padres first baseman Jake Cronenworth hit what appeared to be an RBI groundout to second base. Tyler Wade scored from third. Fernando Tatis Jr. advanced to second. Machado was due up. Ho hum.
But Cronenworth made a signal toward the plate for a catcher’s interference ruling. Sure enough, home-plate ump Cory Blaser made the call, leaving Shildt with an intriguing decision.
On catcher’s interference, the batting team is allowed to accept the result of the play rather than the base that the batter would otherwise have been awarded. Almost always, when catcher’s interference is declined, it’s because the play resulted in a hit, anyway.
But on this occasion, Cronenworth made the inning's second out. He also plated a run. It left Shildt with these two options:
1. Decline the interference, take the out and the run and a 2-0 lead
2. Accept the interference, with Wade returning to third, leaving the bases loaded with one out for Machado and a 1-0 Padres lead
So, what to do? (For all the charts below, click to embiggen)
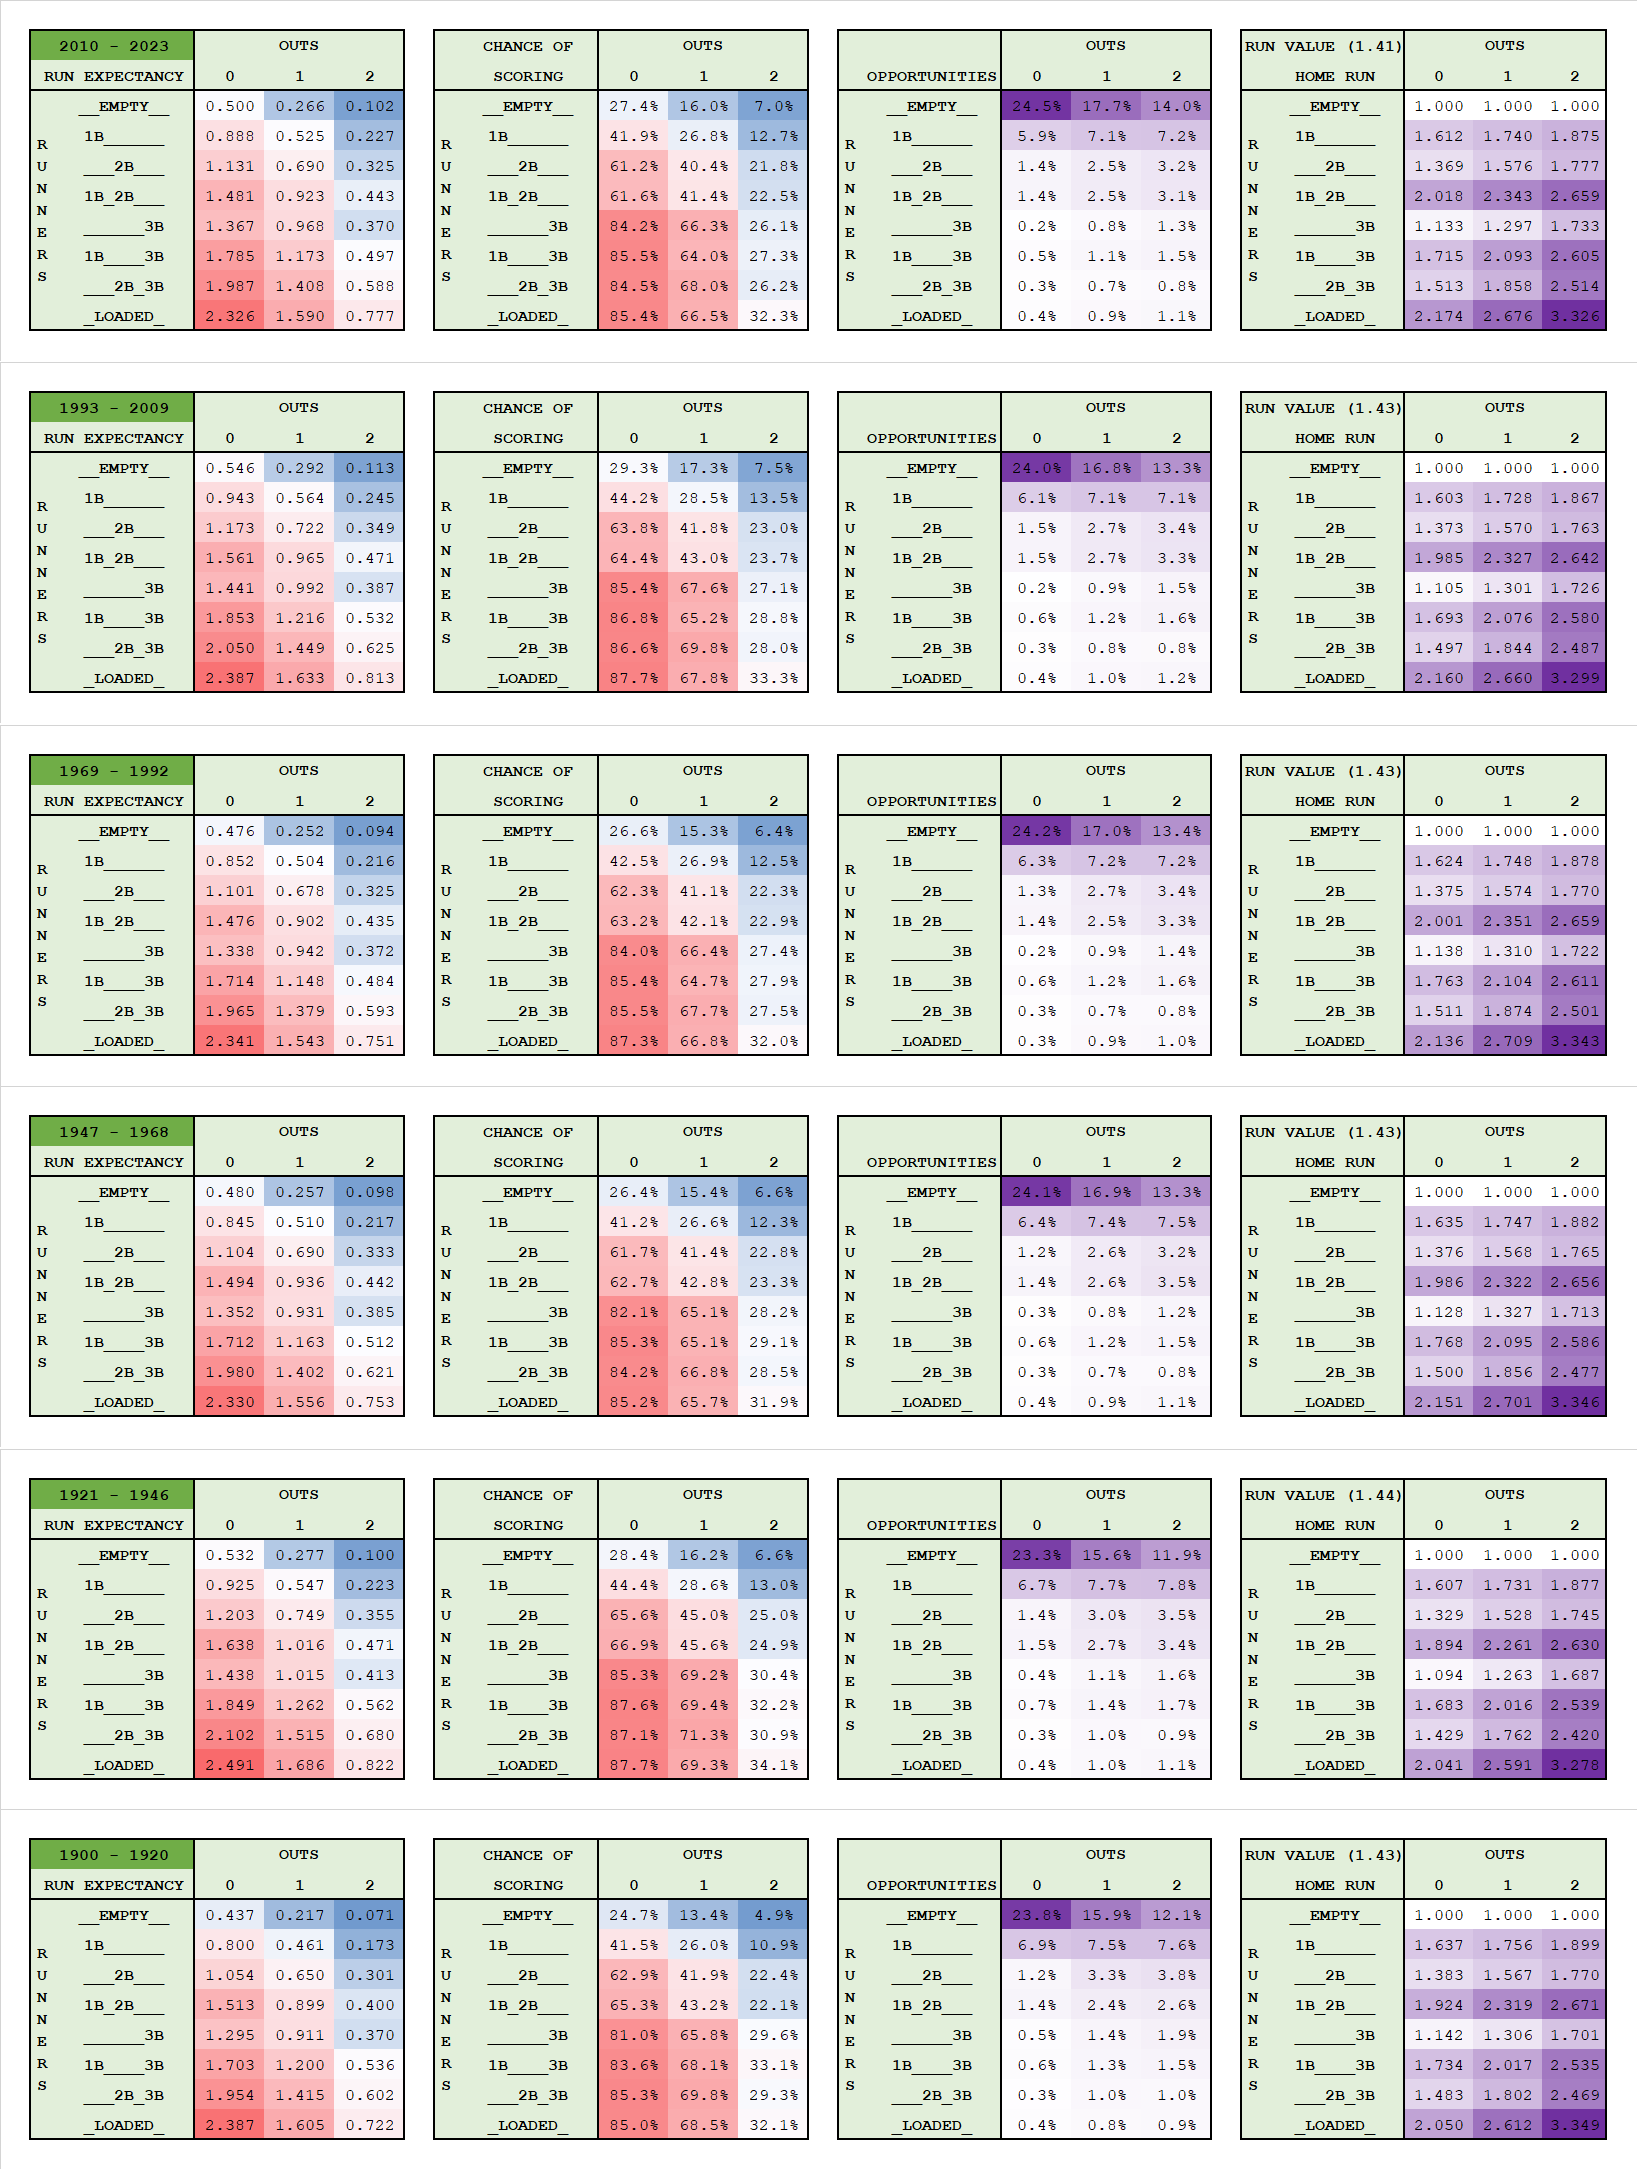
We can start by consulting the
run expectancy charts
.

From that standpoint, we see that bases loaded, one out is worth 1.590 runs, while runner on 2B with 2 outs, and banking the runner is worth 1 plus 0.325 runs. The difference is what we care about, and the difference is a whopping 0.265 runs in favor of taking the run, and out, off the board, and putting those two runners back on the bases.
Adding .265 runs is equivalent to adding almost .03 wins. However, run expectancy is a proxy for win expectancy. And as a proxy, it works well. Until it doesn't.
Next, we consult our
win expectancy
, specific for that half-inning, the bottom of the fifth. And, well, we get something different. The typical home team, up by 1, with the bases loaded and 1 out, has a .799 chance of winning. But, give up the runner on 1B to an out, and plate the runner on 3B for a run, and the win expectancy will go up to .811. In other words, we lose .012 wins by loading the bases (at least with an average batter batting).

So, quite the turnaround here. In a random situation, which is what the Run Expectancy is talking about, we gain almost .03 wins by keeping all our runners on base. But from a Win Expectancy scenario specific to the bottom of the 5th home team up by 1, and we lose .01 wins. That's a .04 win difference, all depending which method you use.
Now, the next step should be to consider who is batting, future HOF Manny Machado. All these charts, they all work nice when everything is average. Run Expectancy assumes an average inning and an average difference in score and average batters and runners and pitchers. While Win Expectancy uses the specific inning and score, it still assumes average players all-around. I will leave this particular step to an Aspiring Saberist.
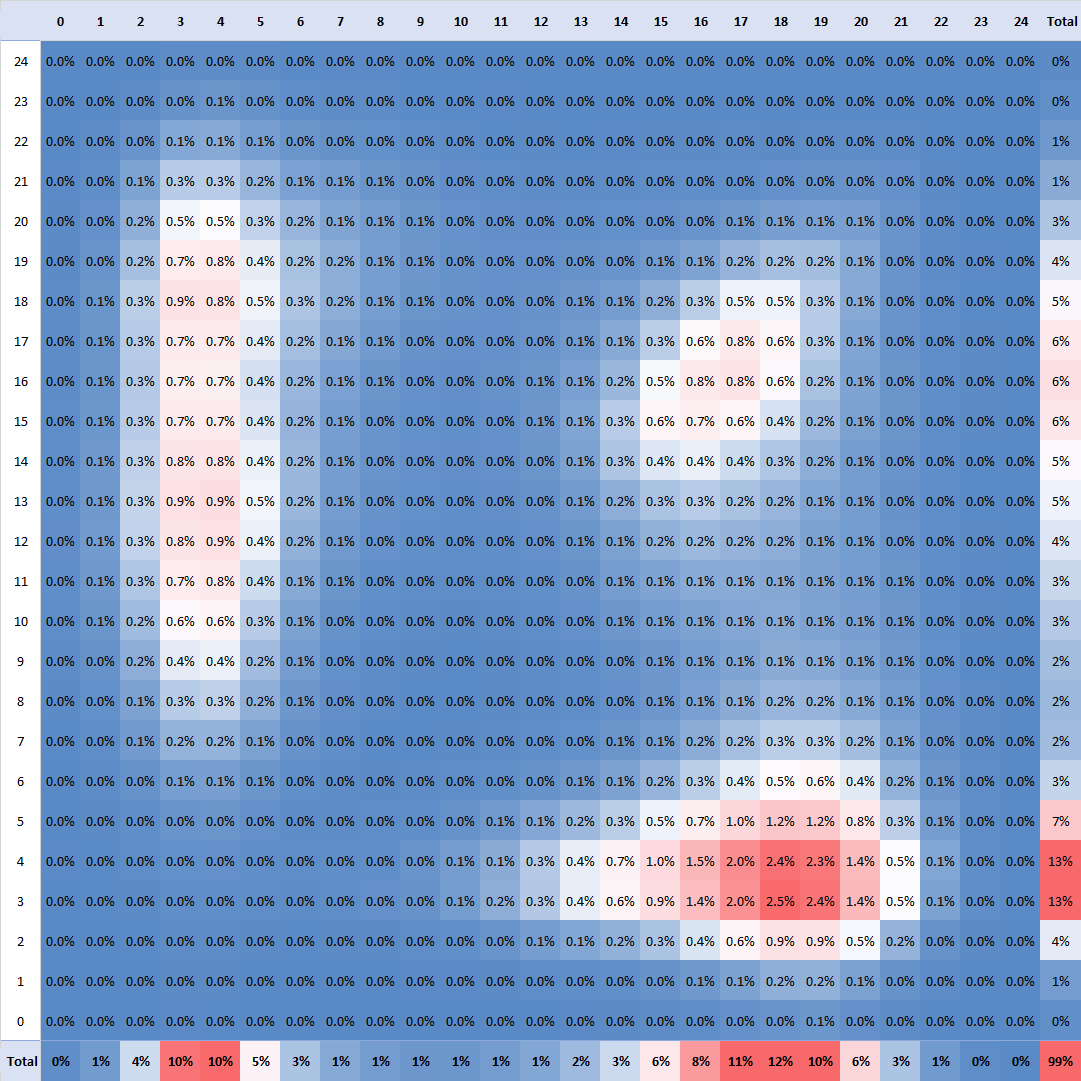
What I want to do instead is look at EVERY half-inning and score, to see when bases loaded is preferred, and when trading two runners for an out and a run is preferred. Here is that chart, and we'll have alot to talk about here.

The top line is the batting team score. Plus means they are ahead and minus means they are trailing. The left column is the inning, split by top/bottom.
The darker the orange (the more negative the number), the more it favors putting the run and out on the board. The darker the purple (the more positive the number), the more it favors keeping the runners on the bases.
- Purple = bases
- Orange = out + run
In the play in question, bottom of 5th, batting team ahead by 1, we can see the value of -0.012, which means it favors putting the run and out on the board, to the tune of .012 wins. This is the Machado scenario, but with an average batter, not Machado, batting.
Ok, now let's look at specific overwhelming choices, where the identity of the players doesn't matter. The biggest is bottom of the 9th, game tied. In this case it should be obvious: plate the run for the walkoff win. That's a .171 win difference over loading the bases. But that was too obvious.
A high one is bottom of the 9th, batting team down by 1 run. In this case, it should be almost as obvious that you put the run and out on the board for a .078 win gain. When you are down by 1 run in the bottom of the 9th, the most important runner is the one that ties it, and the next important runner is the one that wins it. That third runner, the one on first base, that runner is irrelevant. So in this case, you are gaining the run and losing an out, but you are (effectively) only removing one runner from the bases.
On the flip side is bottom of the 9th, batting team down by 2 runs. Suddenly, all three runners are important. That first runner, he's really irrelevant on their own. He's only important if the second runner can also score. Scoring one, without the other, is irrelevant, since in that case, instead of losing by 2 runs, you lose by 1 run. Therefore, in this scenario, it should be quite obvious: load the bases, keep the extra out. This is a .182 win gain.
If you need rules of thumb, here they are:
- when batting team is down by at least two runs, take the interference and load the bases
- when the batting team is ahead by at least two runs, decline the interference and plate the run
- in-between: consult the chart, but if it's close, consider the identity of the batter (like in the play in question, with Machado)
Wednesday, April 17, 2024
- This is a Kodai Senga curveball, thrown in the dirt,
at 63 mph
.
- This is a Kodai Senga curveball, thrown in the heart of the plate,
at 73 mph
.
This chart shows the trajectory of these two pitches, as it travels through SPACE (click to embiggen).

Now, let me show you the height location of these two pitches, as it travels through TIME.

As you can see, these two pitches overlap a great deal.
Let's talk about vertical movement. The traditional way to measurement movement is to draw a tangent line from some point (release for example) to the plate, and compare the difference to its actual location. You can see
an example here
.
In this particular case, the faster curveball would have its tangent line go from release to about 7 feet above the ground. We compare that to its actual location at the plate (about 2 feet), and that difference (about 5 feet) is its vertical drop. This pitch had a vertical drop of 63 inches.
We can break it up into two components:
- the effect of gravity
- everything else
Gravity is easy enough to figure, if you remember your physics kinematic equation: one-half acceleration time-squared. At 0.514 seconds, we get 0.5 x 32.174 x 0.514 x 0.514 = 4.25 feet, or 51 inches. So, 51 inches due to gravity and 12 inches due to everything else. That 12 inches is what we call the Induced Vertical Break (IVB). (Though we really should account for the effect of drag too.)
The slower curveball would have its tangent line go also from about 7 feet to just below the ground, for a total vertical drop of 93 inches. How does that split into gravity and everything else? You might think gravity is 51 inches, but no. Gravity is not based on distance, but time. At 0.610 seconds, that means gravity pulled this pitch down by 72 inches. The remaining, the Induced Vertical Break (IVB), is 21 inches.
Now, how is it possible that two pitches, thrown with similar spin and trajectory can have two such widely different IVB? Time. You see, we are measuring the Induced Vertical Break not with a common time frame, but with a common distance frame. While both pitches travelled the same amount of distance, the slower one took much longer to get there. So, not only does gravity have more time on pulling the ball down, but the spin of the ball also has more time to push the ball down.
What if we wanted to separate that everything-else, that IVB, into both a spin component and time component, could we do that? Sure thing. First, we have to figure out how much of a time frame we are interested in. I will suggest, mostly for illustrative purposes, that we'll measure the downward movement over a span of 0.3 seconds.
When we do that, the effect of gravity is now identical for both pitches: 17 inches. We've been able to effectively neutralize gravity. And this is true not only for these two curveballs, but for any pitch, no matter how fast or slow. Gravity will always pull a ball down by 17 inches over a 300 msec time frame. In addition, the vertical drop of the two Senga pitches is also identical at 22 inches. These two balls spin the same, so given the same amount of TIME (not distance) they will also have the same spin-effect.
This is how both pitches look broken down into components, all numbers in inches:
63: vertical drop over full flight
- 22: vertical drop over 300 msec
- 17: gravity over 300 msec
- 5: induced over 300 msec
- 41: vertical drop over remaining flight
- 34: gravity over remaining flight
- 7: induced over remaining flight
93: vertical drop over full flight
- 22: vertical drop over 300 msec
- 17: gravity over 300 msec
- 5: induced over 300 msec
- 71: vertical drop over remaining flight
- 55: gravity over remaining flight
- 16: induced over remaining flight
Is there a reason to prefer 300 msec over the entire flight? Imagine for example trying to measure IVB on a curveball throw from the catcher to 2B. Because of that amount of distance (or time), that throw would have a massive amount of vertical drop, a large portion would be gravity, but also a good amount would be IVB. Even though the spin of the ball would be no different than throwing from the mound. A batter does not need to worry about the entire trajectory of the pitch, just a small portion of the flight, inside the decision-making zone. To that end, we don't need to worry about measuring everything from release or from a common distance. The decision-making zone just requires a common TIME frame.
It would therefore become a decision point for the analyst and user as to what you want to do with IVB, how you want to compare two different pitches. Are you trying to isolate the effect of the spin of the ball? Or, are you trying to include the speed of the throw as well? What is it that you are trying to isolate?
From my standpoint, we can actually isolate everything. And then the user is free to include or exclude whatever components they want.
***
A few extra math notes. You can
estimate the effect of gravity
using pitch speed as (523 / Speed) ^ 2
A 63 mph pitch for example would be (523 / 63) ^ 2 = 69 inches (in the above pitch we calculated 72).
And 73 mph pitch: (523 / 73) ^ 2 = 51 inches (same number as we calculated above).
This shorthand is useful especially for those who don't have the time-to-plate handy, but do we have their pitch speed handy.
***
The total amount of break is proportional to the square of the time. In the above two pitches, one took 610 msec to get to the plate, while the other was 514. Divide the two, and we get 1.19. Square it to get to 1.41. Remember how the total vertical drop for the two pitches was 93 and 63 inches? 93/63 is 1.48. We're off by a few inches, mostly because these two pitches are not identical.
We can also look at the 300 msec compared to the full flight of 514 msec. Since 514 msec pitch had a total vertical drop of 63 inches, we'd therefore expect 300 msec to be 300/514 or .584, which we square to .34. And 63 x .34 is 22 inches, the earlier number we calculated.
Similarly, the other pitch is 300/610, or .492 squared, or .24. Which we multiply by 93 to give us 22 inches, the same earlier number we calculated.
***
Anyway, I hope all this shed some light on the Total Vertical Drop and the Induced Vertical Break.
Wednesday, April 10, 2024
In a series of tweets many years ago, I described how to work with plus/minus. You can see
part 4
,
part 5
, and
part 6
, especially. One of the problems we have with plus/minus is the mixing of even-strength and specialty team goals (while PPG scored or allowed aren't included, shorthanded ones are). Thanks to the terrific site from
Natural Stat Trick
, we can handle that aspect quite easily. For my purposes, I selected Even Strength, though of course breaking that down into 5-on-5, 4-on-4, 3-on-3, would be helpful. It's also not clear how goalie-pulled is handled (presumably even-strength), and that should be broken down as well. But, no biggie here, we're just laying the groundwork.
The main problem with plus/minus is that it is heavily team dependent. But, we can do something about it, which is what those three parts I linked above describe. I'll implore you to read those, but I am going to presume some of you won't and will ALSO have an opinion as to why it doesn't work! Again, please read those.
If you really insist on not reading it, I'll give you the briefest of illustrations: if the Habs with Saku Koivu is +30 EV goals with him on the ice, and +30 with him off the ice, what can we do about it? Well, first we have to know the ice time. Let's assume Saku is on the ice one-third of the time (aka, one part on, two parts off). So, the +30 off-ice needs to pro-rate down to +15. The +15 is 5 semi-random Habs. That makes each Hab player would be +3. Next, we have Koivu + 4 Habs being +30. Since we just established that each Hab player is +3, then Koivu + 12 equals 30. And so Koivu is +18. So, that's how +30 on, and +30 off converts to +18 for the player. Again, please read those links.
Back in 2006-2008, I worked for a few NHL clubs, via a consulting company. One of the stats we created was called NetShots. You may know it by other terms since then, like Corsi, or Fenwick, or SAT or USAT. They all do the same thing: count the number of shots on ice taken by the team and allowed by the team, with the player on the ice. It's just a matter of what to call a "shot", whether you limit yourself to shots ON goal (meaning it's either a save or a goal), or shots AT goal (includes wide shots, or shots that hit the crossbar/post), or even blocked shots. I'm not here to tell you which is the best, or maybe how to even weight them. Well, I have written about it in a posted I called
Weighted Shots Differential
, but I haven't really tested it, and others are free to do so.
So everything that applies to Net Goals can also be applied to Net Shots. Shots are often preferred for their volume, and for neutralizing the goalie. That's fine, I'm not here to choose. I'll just show both.
My purpose here is just to present the work I did last night, basically spending 5 minutes downloading the data, another 20 minutes making the calculations, and 20 minutes writing this blog post. My hope is others pick up the many pieces here, read though my entire set of articles, and come up with something more comprehensive. In the meantime, here you go (click to embiggen).
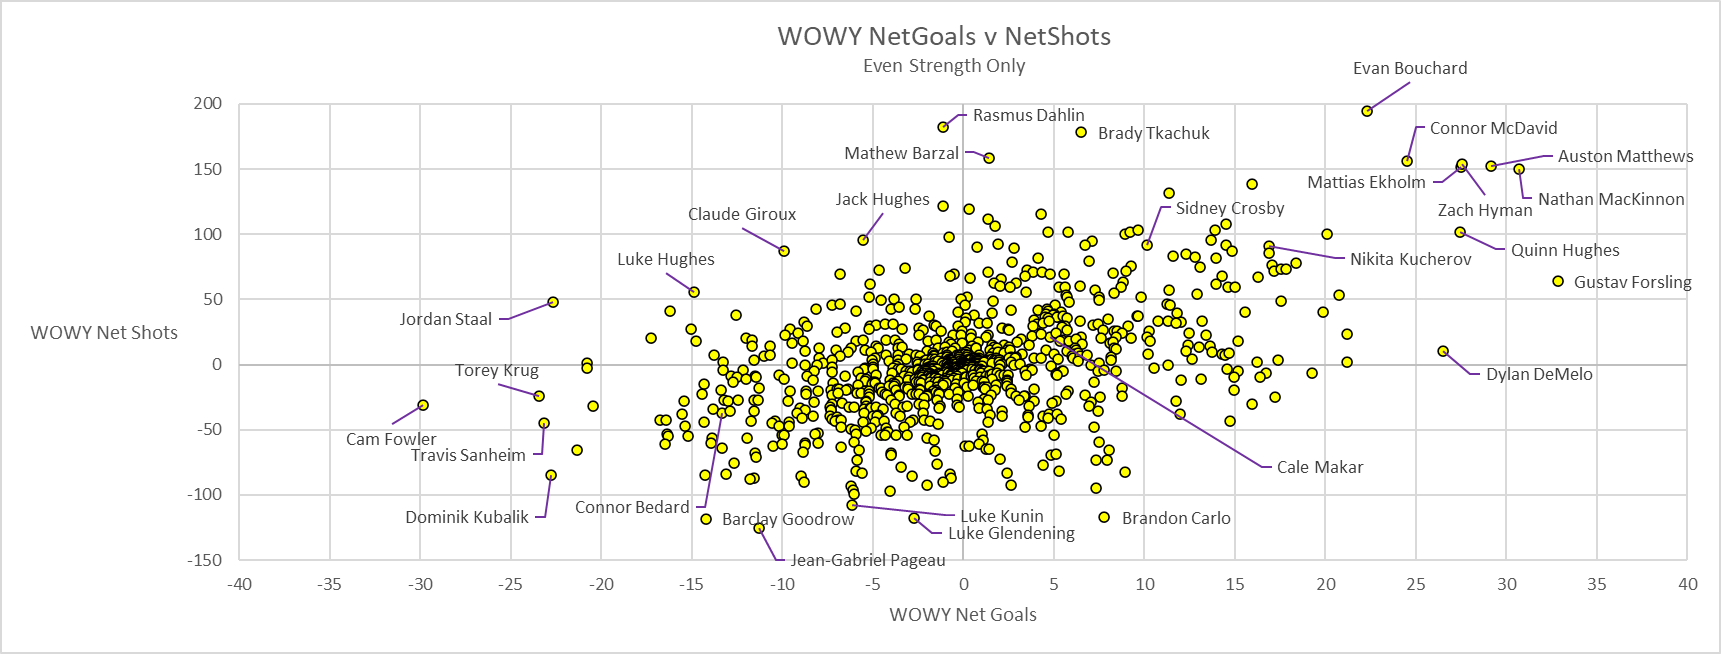
- McDavid is at +25 WOWY NetGoals and +156 NetShots.
- AM34 is +29, +152.
- MacKinnon is +31, +150.
- Hyman: +28, +154. We're going to have a tough time separating linemates here.
- Kucherov: +17, +91. This is after our best effort to handling Bolts
- Barzal: +1, +158. This is a huge disconnect between actual goals, and actual shots. What to believe?
- Brady Tkachuk: +7, +178. The leader in WOWY NetShots among forwards, but the goals don't match. What to do?
- Jack Hughes: -6, +96. That's a reverse effect
- Crosby: +10, +92. He's still going strong
- Giroux: -10, +87. Like Jack
- Jordan Staal: -23, +48. Whoah, that's quite the disconnect
- Connor Bedard: -13, -37. Sorry, dude, nothing to hang your hat on here
How about the D?
- Forsling: +33, +64. Good with NetShots, and outstanding on NetGoals. Why?
- Ekholm: +27, +152
- Quinn Hughes: +27, +101
- DeMelo: +27, +10. Barely above average on NetShots, outstanding on NetGoals. Again, why?
- Evan Bouchard: +22, +194, our leader in WOWY NetShots
- Dahlin: -1, +182. Second in NetShots, and average in NetGoals, which is a tremendous disconnect.
(6)
Comments
• 2024/04/11
Tuesday, April 02, 2024
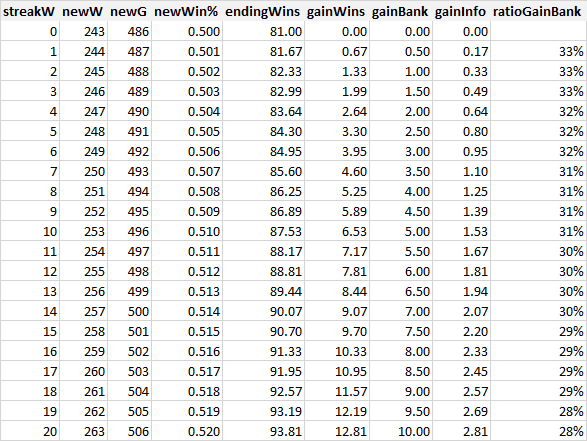
Suppose a team starts the season 3-0, but you had them entering the season to end 81-81. What is your new forecast? If that 3-0 record means nothing at all, then you'd assume they play .500 the rest of the way (in 159 games), and you add 3 wins to that, and you get 82.5 wins. In other words, they gain +1.5 wins in the final season forecast, based strictly that 3-0 is +1.5 ahead of 1.5-1.5.
But, the pre-season forecast can't carry a weight of an infinite number of prior games, such that adding 3-0 to that means nothing at all. Suppose that the pre-season forecast has the weight of three full seasons. Here's what happens to the final season forecast after streaks of 1 to 20 games, and how much information those extra wins gives us.
This three-season weight is an ILLUSTRATION. We need to figure out that weight. My expectation is that that weight is going to be somewhere between 1 and 3 seasons of weight. Aspiring Saberists, Assemble.
Monday, April 01, 2024
So, this was a pretty odd play. It's the top of the 9th, tie game. The nominal win% for the home team is .500. (It should be .520, all other things equal, and naturally we need to consider the identity of the players, but let's make it easy, and use the base charts
available here
.)
The first batter walks. That's normally worth .030 wins, but in this high leverage scenario, it's worth .082 wins. Now the home team chance of winning goes down to .418. The next batter has an almost easy DP, but the 2B
misplays it for an error
, with runners now at the corners. Terrible fielding by the home team drops their chances of winning all the way down to .194.
Having a runner on 3B with less than two outs is a very powerful thing for the batting team. They are in control. So what do they try?
A bunt
. And not a safety-squeeze, no. But the other kind. Let's see what the batting team might have been thinking.
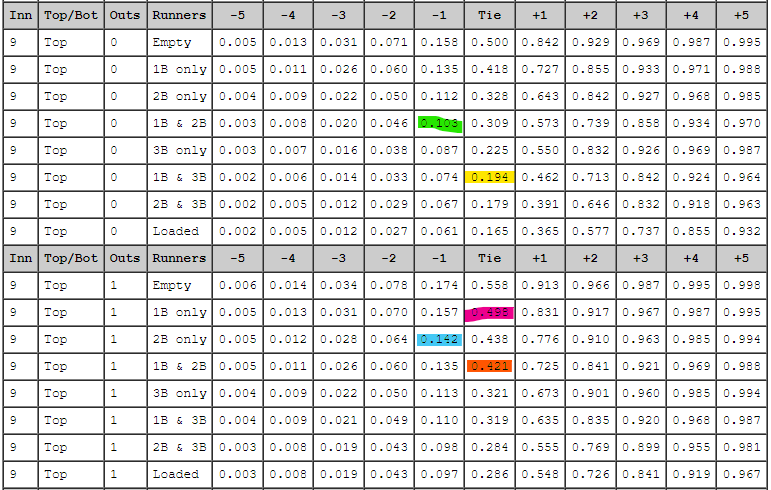
Remember, the chance of the fielding/home team winning is down to .194. If they pull off this bunt, we have a runner scoring, and runners on 1B and 2B. That puts the winning % for the home team down to .103. But if the worst happens (as it did), the home team chance of winning goes skyrocketing to .498. In other words, that walk that happened, that error that happened? All of that vanishes, and we are back to where we were when we started the inning.
So, you have a chance to gain +.09 wins with the perfect bunt, and you have a chance to lose .30 wins with a missed bunt. You have to be 77% sure that you will get that bunt.
And in fact, it should be higher. Because one of the outcomes is to score the run, but give up the out, and that sets the win% for the home team to .142, so only +.05 wins for the home team. It's also possible you don't get the worst-case scenario, but just a really bad scenario: you lose the runner, but get the batter on base for a home win% of .421 and so a cost of .23 wins.
All in all, it's probably a play you need to make 85% of the time. Which is why you don't see this play performed. I'd like to say ever? An Aspiring Saberist out there can do the legwork.
See, there are places where guts and instincts have a role. When there's enough uncertainty in the math, if there are enough variables to consider, you can push up an extra .01 or .02 wins here, and push down an extra .02 or .03 wins there. There's uncertainty. But in this particular case, when the breakeven point is already ridiculously high, there's not enough uncertainty in the numbers to allow for guts and instincts to possibly play a role.
There's probably three dozen choices a manager can make throughout the game that could go contrary to the numbers, but be justified based on uncertainty of the numbers, and the guts/instincts of the manager. This play was nowhere close to being one of those that required the manager to step in.
Sunday, March 31, 2024
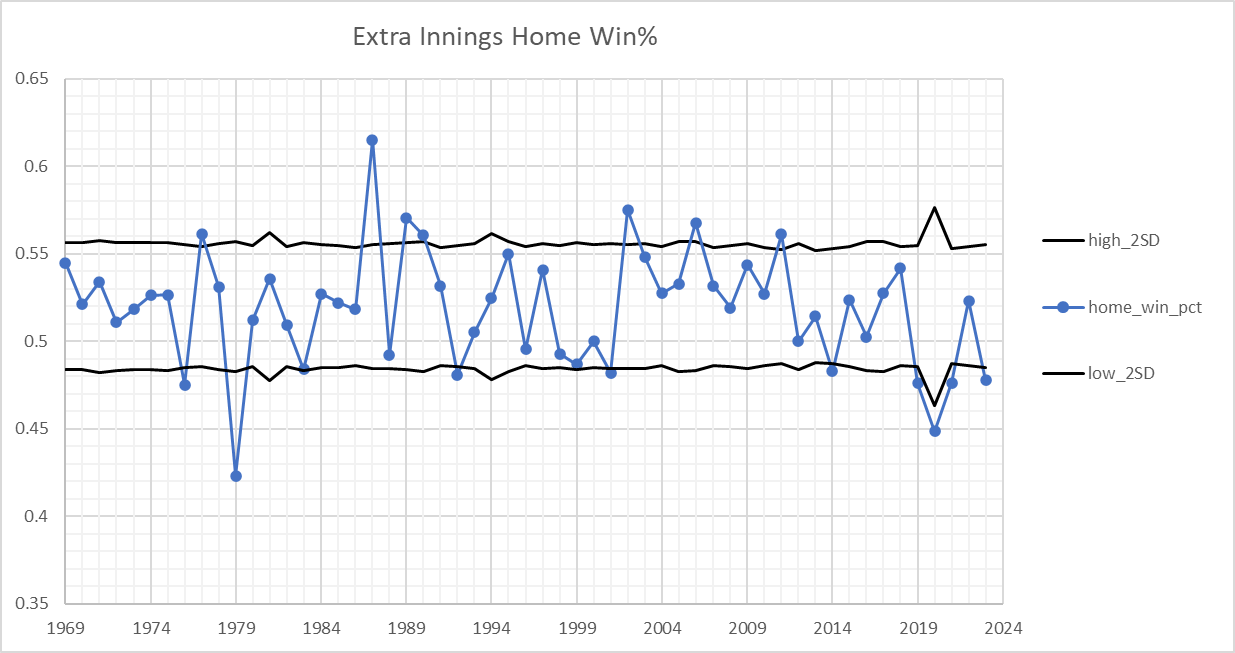
Home win% in regulation games is 54%, but falls to 52% in extra innings for
totally normal reasons
, having nothing at all to do with who bats first or last.
This chart shows the win% season by season since 1969. I've included the Random Variation lines, which I have nominally set at 2 standard deviations. This implies we should expect to see 5% of these 55 data points (aka 3) to land outside these two lines. We see alot more than that. Why, I don't know. I used a flat 52% expected win%, and maybe it should be 51.5% one year and 52.5% another year. I'll leave that to the aspiring saberists. (click to embiggen)
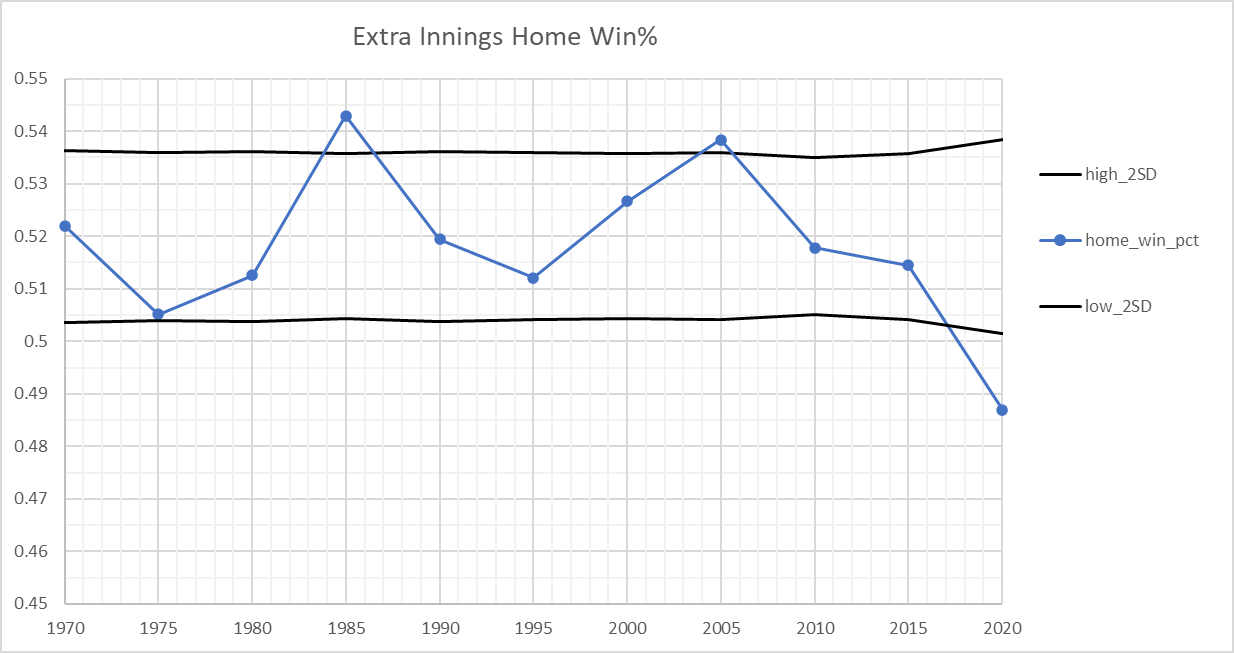
Of course, the most striking thing in the chart is what's happened since 2020, with the extra inning placed runner (XIPR). Though inconveniently, the pattern started the season prior to that. Anyway, here's how it looks when we group in chunks of five seasons. The data point for "2010" you see at the bottom refers to seasons "2010 - 2014". And "2015" is "2015 - 2019".
We should only see, maybe, one point outside the 2SD lines, but we see three, with the one from 2020-present way outside even this standard. Something is definitely going on with how teams are approaching playing with the XIPR. I'm sure an aspiring saberist can look into this. Are there any teams that have figured it out? I'll leave that up to y'all to show.
Monday, March 25, 2024
Let's create a simple basketball game, where regulation is made up of 100 free throws by each team. The free throw line is several feet further out than the current rules, such that the average free throw percentage is 50%. Home teams average 51%, while away teams average 49%.
In regulation play, after 100 throws from each, the home team will win 58.4% of the time, and tie 5.4% of the time.
Let's create an Overtime game that is 10 free throws by each team, to act as the tie-breaker. With much fewer confrontations, the chance that the home team will win outright is much lower than during regulation. It will actually be 44.7% to win outright, 37.7% to lose outright, and another 17.5% to get into another Overtime period. The OT win% for such a home team will end up being 54.3%
And that means that the overall win% for home teams will be 58.4% plus 5.4% times 54.3%, or 61.4%.
This is how you can take a team that has a seemingly small home-site advantage (making 51% of free throws instead of 50% at the individual play level), balloon all the way to 61.4% at the game-level. And that it's only 54.3% in Overtime. Scoring Confrontations. That's the reason.
And this explains why in MLB, the home team win 54% of their games, and yet wins only 52% of their Extra Inning games. In baseball, instead of having 100 scoring confrontations each, they have 9 innings each. And the home team scores 52% of the runs in each inning. And when you do that, you end up winning 54% of games. But still 52% of an inning, like an extra inning.
You can apply this concept to hockey and soccer and you will see you can create a simple model to explain it. Football is different because of the possession rule.
Thursday, March 21, 2024
Whether you use Pythag wins from Bill James or Patriot or the more basic one from Pete Palmer (0.1 wins per run), they all treat runs the same: you add it up at the seasonal level, and proceed. None of them do it game by game.
When we use the Palmer method, it works like this, if you try to apply it at the game-level: Win the game by 1 run, and that's worth +.10 wins above average or 0.60 wins. Similarly, win by outscoring your opponent by 2 runs means that game is worth 0.70 wins. Winning by 3 means it's worth 0.80 wins, and so on. Winning by 5 is worth 1.00 wins. Winning by 10 is worth 1.50 wins.
Losses operate the same way. Losing by 1 run earns you 0.40 wins, losing by 2 earns you 0.30 wins. Losing by 5 is 0 wins. Losing by 10 is negative 0.5 wins.
Add all of these up, and over 162 games, you get your equivalent wins. Of course, there's no point to doing this game by game, since doing it at the seasonal level as runDiff*0.10 + Games*0.500 gives you the identical answer.
We are of course missing the context of each individual game. In the Palmer method, winning 9 games by 1 run, and losing one game by 9 runs gives you the same answer: total run differential is 0, and so, converts to the equivalent 5 wins and 5 losses.
But, what if winning by one run is not worth 0.60 wins like Palmer implies, but instead is worth 0.83 wins. And winning by two runs doesn't add 0.10 wins like Palmer implies (worth 0.70 wins), but 0.09 wins, to give us 0.92 wins. And winning by 3 runs adds 0.08 wins to give us 1.00 wins. So, winning by THREE is a full win, while Palmer implies winning by FIVE is a full win.
Here are the gradient wins each team gets, game by game:
Score Win Lose
1 0.83 0.17
2 0.92 0.08
3 1.00 0.00
4 1.07 -0.07
5 1.13 -0.13
6 1.18 -0.18
7 1.22 -0.22
8 1.25 -0.25
9 1.27 -0.27
10+ 1.28 -0.28
When we do that, how does 2023 look? The Orioles you may remember had a modest run differential of +129 runs implying +13 wins above average or 94 wins. The Gradient Wins approach gives them 100 wins. They actually won 101 games. What we are doing is giving them more credit for their close games, and not giving full credit to every run in a blowout win or loss.
The Marlins allowed 57 more runs than they scored, implying 75 equivalent wins. The Gradient Wins approach gives them 80 wins. They actually won 84.
That illustrative team of 9 games winning by 1, and 1 game losing by 9 is 9 actual wins and 1 actual loss, while Palmer said it's 5 wins and 5 losses. In the Gradient approach, it comes out to 7.2 wins.
Is this necessarily better than what Palmer or the Pythag methods suggest? No. Or at least, I don't know yet. But it opens the door for better handling blowouts and close games. We know winning by one run has to be more than 0.6 wins. We can't treat each run the same. We also know that winning by one and by ten runs can't be the same, even though you get one actual win. Does it make more sense to give a one-run win 0.83 wins and a ten-run win 1.28 wins? I know I like that more than giving it 0.60 and 1.50 wins as Palmer suggests. And I know I like it more than giving 1 win and 1 win as actual wins says.
Next step is for Aspiring Saberists to take over.
Wednesday, March 20, 2024
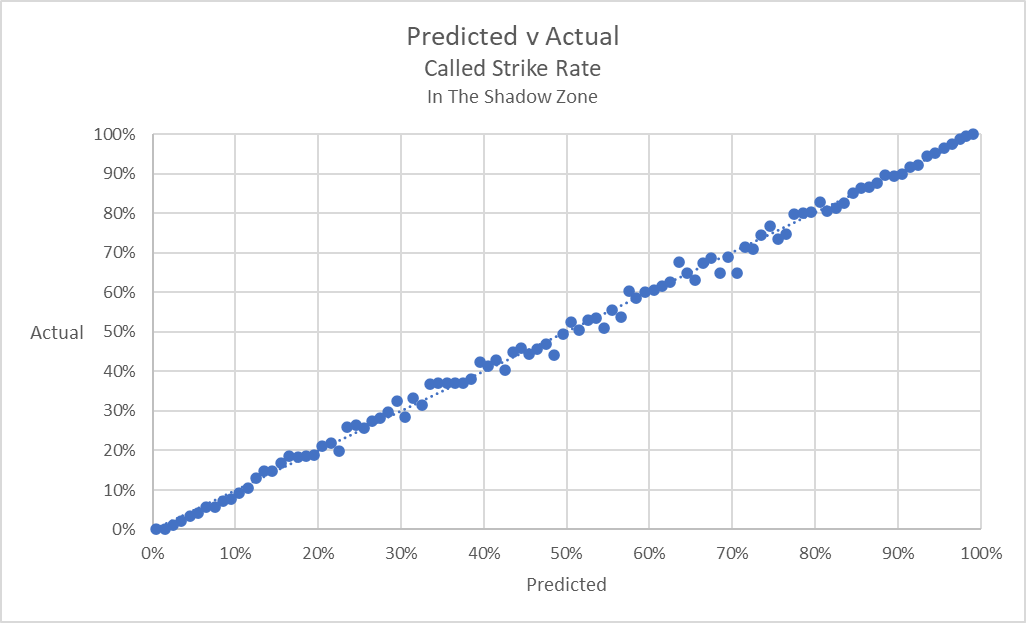
We made an update in process, with a big payoff at the pitch-level, with an overall modest impact to the catcher framing. The current method broke up the regions over the plate into 5 regions, with the prominent one being the Shadow-In (80% called strike rate) and Shadow-Out (80% called ball rate), with adjustments for pitcher and venue. The new method updates the Shadow Zone process so it is a continuous probability from 0 to 100%, using the specific plate location, with adjustments for bat-side and pitch-hand. Statcast Data Whiz Taylor did the bulk of the work here.
At the aggregated seasonal level, you won't see much difference. Current Savant and Steamer at Fangraphs, for 2023, have a correlation of r=0.94. This will increase to r=0.98 with the new model. The current Savant process would apply adjustments at the aggregated level. We did this because we never thought that we'd need to show the strike probability on a pitch by pitch basis. And since Catcher Framing was one of the very first metrics we created, it languished in this regard. But thanks to Taylor and their team, a process was built to apply adjustments at each pitch. By doing that, it will allow us to slice/dice the data the way we do with other data, like Catcher Blocking and Throwing, etc.
Here is how the binned data (100 bins) looks like, comparing the predicted strike rate with the actual called rate. (click to embiggen)
Monday, March 18, 2024
As my side-project into
NaiveWAR continues
, I'd like to also highlight the work of
Sean Smith
, the progenitor of WAR at Baseball Reference.
I currently have two versions of NaiveWAR. The first based solely on a pitcher's Won-Loss record. And the second based solely on the pitcher's Runs Allowed and IP. Whether in my version, or from Sean Smith, we present it in the form of Individualized Won-Loss Records (aka The Indys). My biggest failing in presenting WAR was not including The Indys. And based on what Sean is doing, he seems to perhaps agree as well.
There's a good reason this is needed because the discussion over the replacement level was actually mostly noise to what is actually WAR. That is my fault, as that conversation got away from me, and I didn't have a way to control that.
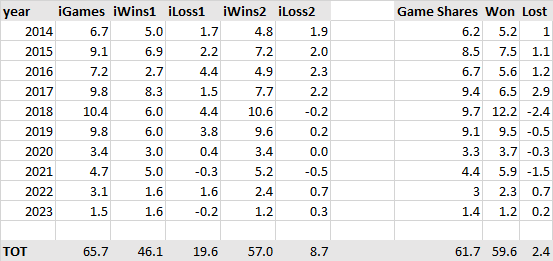
Anyway, you can see my two versions on the left (and since this is deGrom, you'll be able to guess which version is which). And Sean's version is on the right. Sean of course is doing alot more than what my Naive approach is doing. And, you can see a tremendous amount of overlap. Which really means that all that tremendous extra work, necessary work, is ALSO noise to the main discussion point of WAR. Make no mistake about it: not only is Sean right for doing what he is doing, but I will also be doing an enhanced version (eventually, whenever I have the time).
But more importantly: the Naive approach is necessary to bring everyone to the wading pool, before we jump into the deep end. WAR has taken on a life of its own, too easy to dismiss because it's too easy not to learn what it is. That's why the Naive approach is necessary. We need folks to get into the wading pool, and then into the shallow end, before we get into the deep end. And what we see with deGrom above is that the difference between the shallow end (Version 2) and the deep end (Sean's version) may not be that big of a dive.
(11)
Comments
• 2024/03/20
•
WAR
Thursday, March 14, 2024
Just the first step in looking at this. The left column is the height of the left knee, the top row is the right knee.
The most common position for the catcher is for the left knee (the glove knee) to be 3-5 inches off the ground, while the right knee is 17 to 20 inches off the ground.
We do see the catcher often enough with their right knee 3-5 inches off the ground, with the left knee 11-20 inches off the ground. I should probably split this by bat-side (and maybe pitch-hand).
Having both knees up, 14-19 inches off the ground is the least popular of the setups.
I'll be looking as well to see how the called strike rate is affected based on the catcher stance.
(Click to embiggen)
Sunday, March 03, 2024
In my spare time, I'm working on an open-source WAR, that I call NaiveWAR. Those of you who have been following me know some of the background on NaiveWAR, notably that it is tied (indirectly to start with) to Win/Losses of teams (aka The Individualized Won/Loss Records). My biggest failing in developing the WAR framework was not also providing the mechanism for W/L at the same time. That will be rectified.
The most important part of all this is that it's all based on Retrosheet data, and everyone would be able to recreate what I do. And it would be totally transparent, with plenty of step by step discussion, so everyone can follow along. I was also thinking of potentially using this as a way to teach coders SQL. That's way out in the distance, still have to work things out, but just something I've been thinking about as I'm coding this. I even have the perfect name for this course, which I'll divulge if/when this comes to fruition.
Interestingly, RallyMonkey, who is the progenitor of the WAR you see on Baseball Reference seems to be embarking on a somewhat
similar campaign
. You can see alot of the overlap, with tying things to W/L records, with the emphasis on Retrosheet. The important part of doing that is we'd be able to do it EACH way, with/without tying it to W/L, so you can see the impact, at the seasonal, and career, level. In some respects, he'll go further than I will with regards to fielding, mostly because I have so little interest in trying to make sense of that historical data, given the level of access Statcast provides me. But also partly because by me not doing it, it opens the doors for the Aspiring Saberists to make their mark, that somewhere between my presentation and Rally's presentation, they'll find that inspiration.
All to say: I dunno what I'm trying to say!
(28)
Comments
• 2024/05/28
•
WAR
Saturday, February 24, 2024
This shows the following, for the entirety of the Retrosheet data, broken up into roughly 15-20 year time periods
- Run Expectancy
- Run Frequency
- State Frequency
- Run Value of HR
(Click to embiggen)