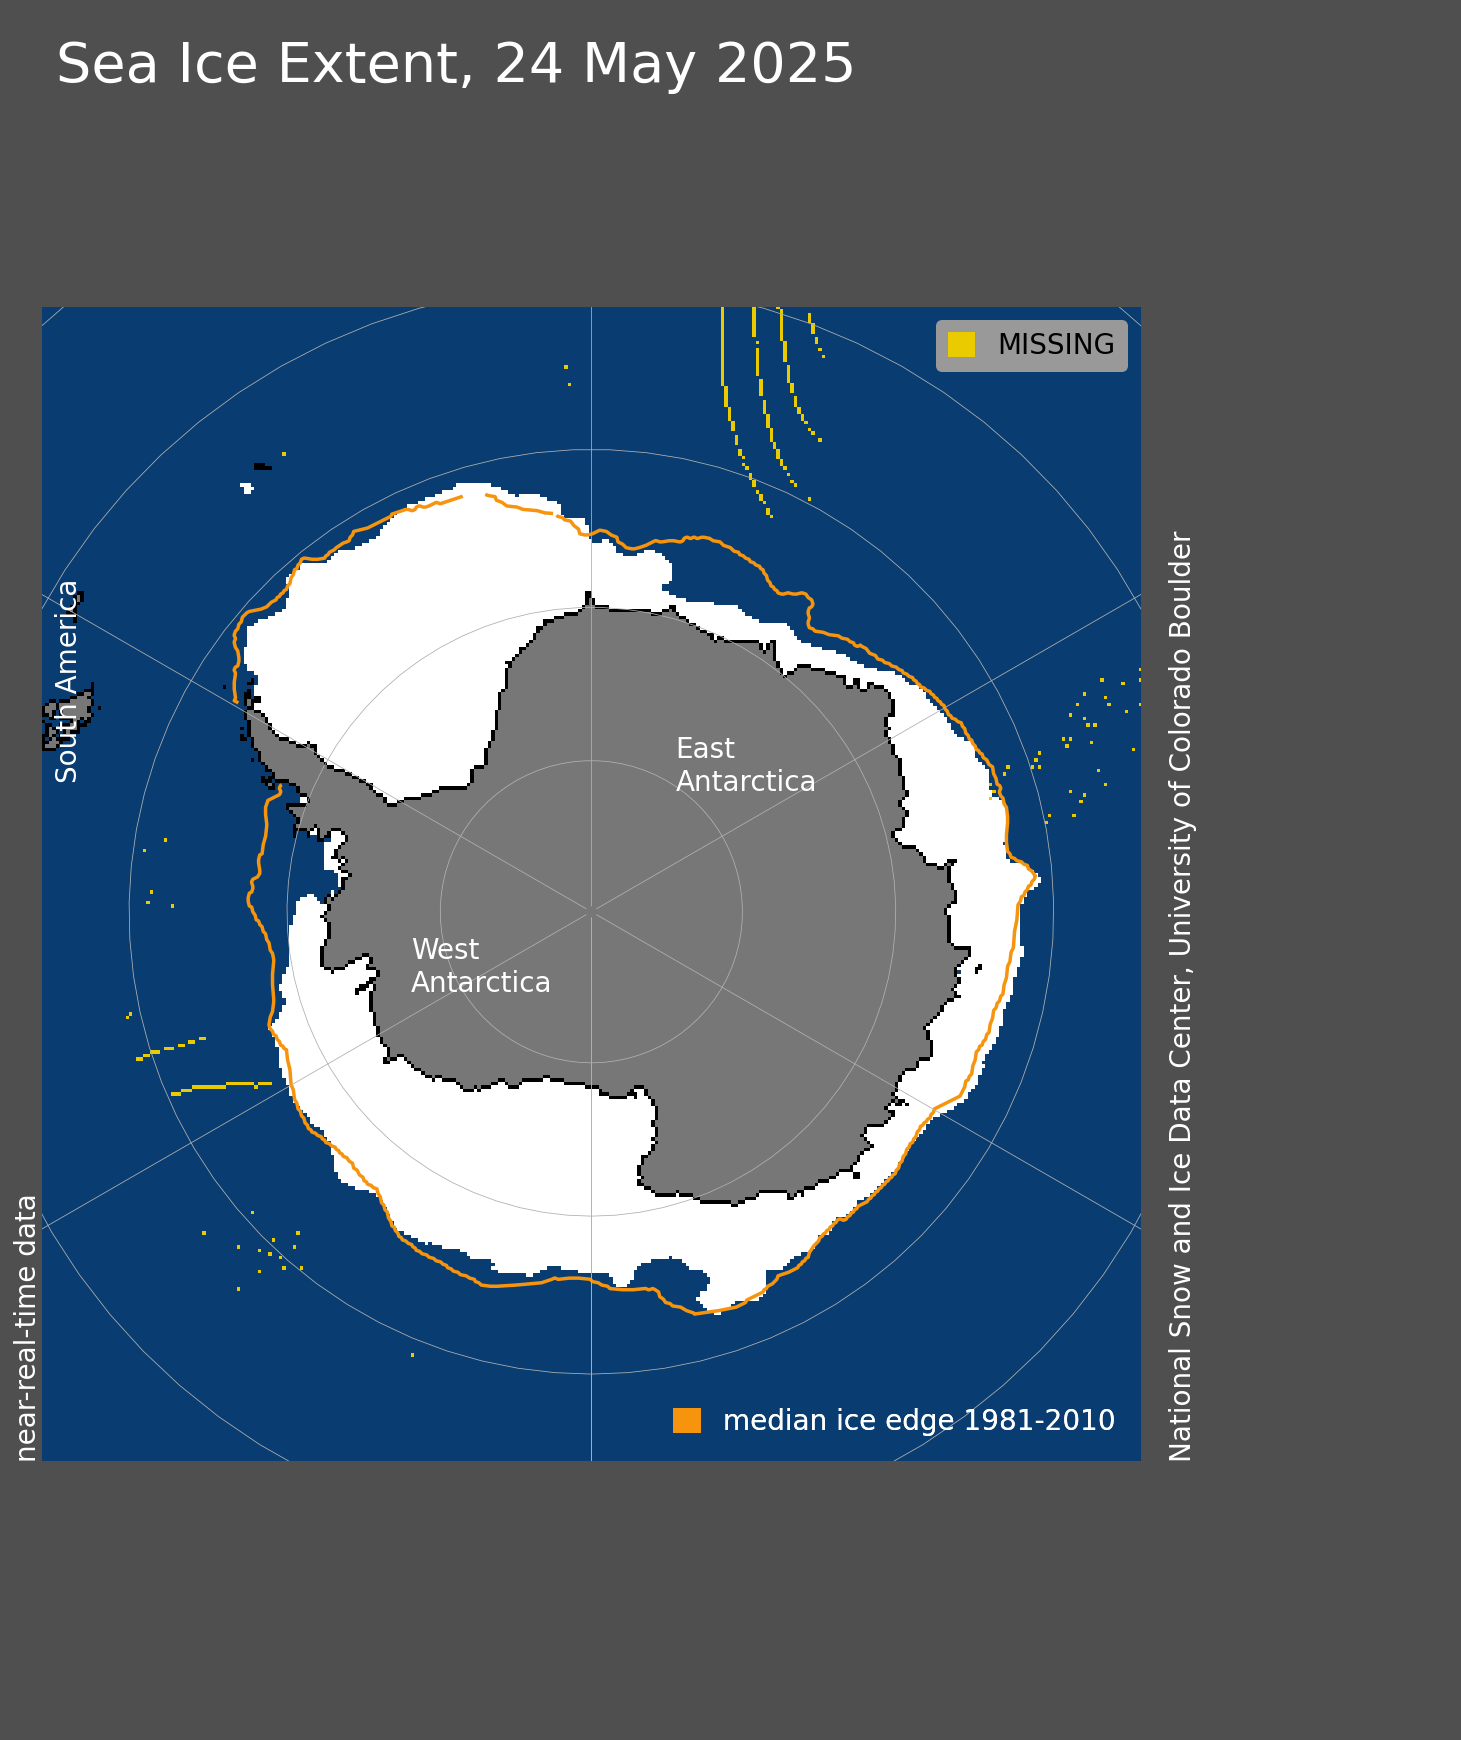
The daily Sea Ice Index provides a quick look at Antarctic-wide changes in sea ice. It provides consistently processed daily ice extent and concentration images and data since 1979. Daily extent images show ice extent at concentrations greater than 15% for a given day with an outline of the typical extent for that day based on a 30-year (1981-2010) median (orange line).
Daily Sea Ice Extent Time Series
This graph provides a snapshot of changes in ice extent for the last four months. The graph shows a time series for the Southern hemisphere (solid blue line). The graph also includes a comparison line for the 1981 through 2010 average (solid grey line) that is plotted for the previous four months as well as the upcoming month. The light gray area around the 1981-2010 average line shows the two standard deviation range of the data. The graph also includes lines for selected earlier years, for comparison (dashed dark blue line).
Read more ...

  | Daily Sea Ice Extent
These images show the extent of ocean covered by ice at any concentration greater than 15 percent for a given day. This snapshot of current ice conditions may be missing data (missing data appears as gray dots or areas). The median line (orange in images) shows a typical ice extent for that day based on data from 1981 through 2010. The area around the North Pole that the satellite does not image is assumed to be covered by ice at more than 15 percent concentration.
See documentation for details.
|
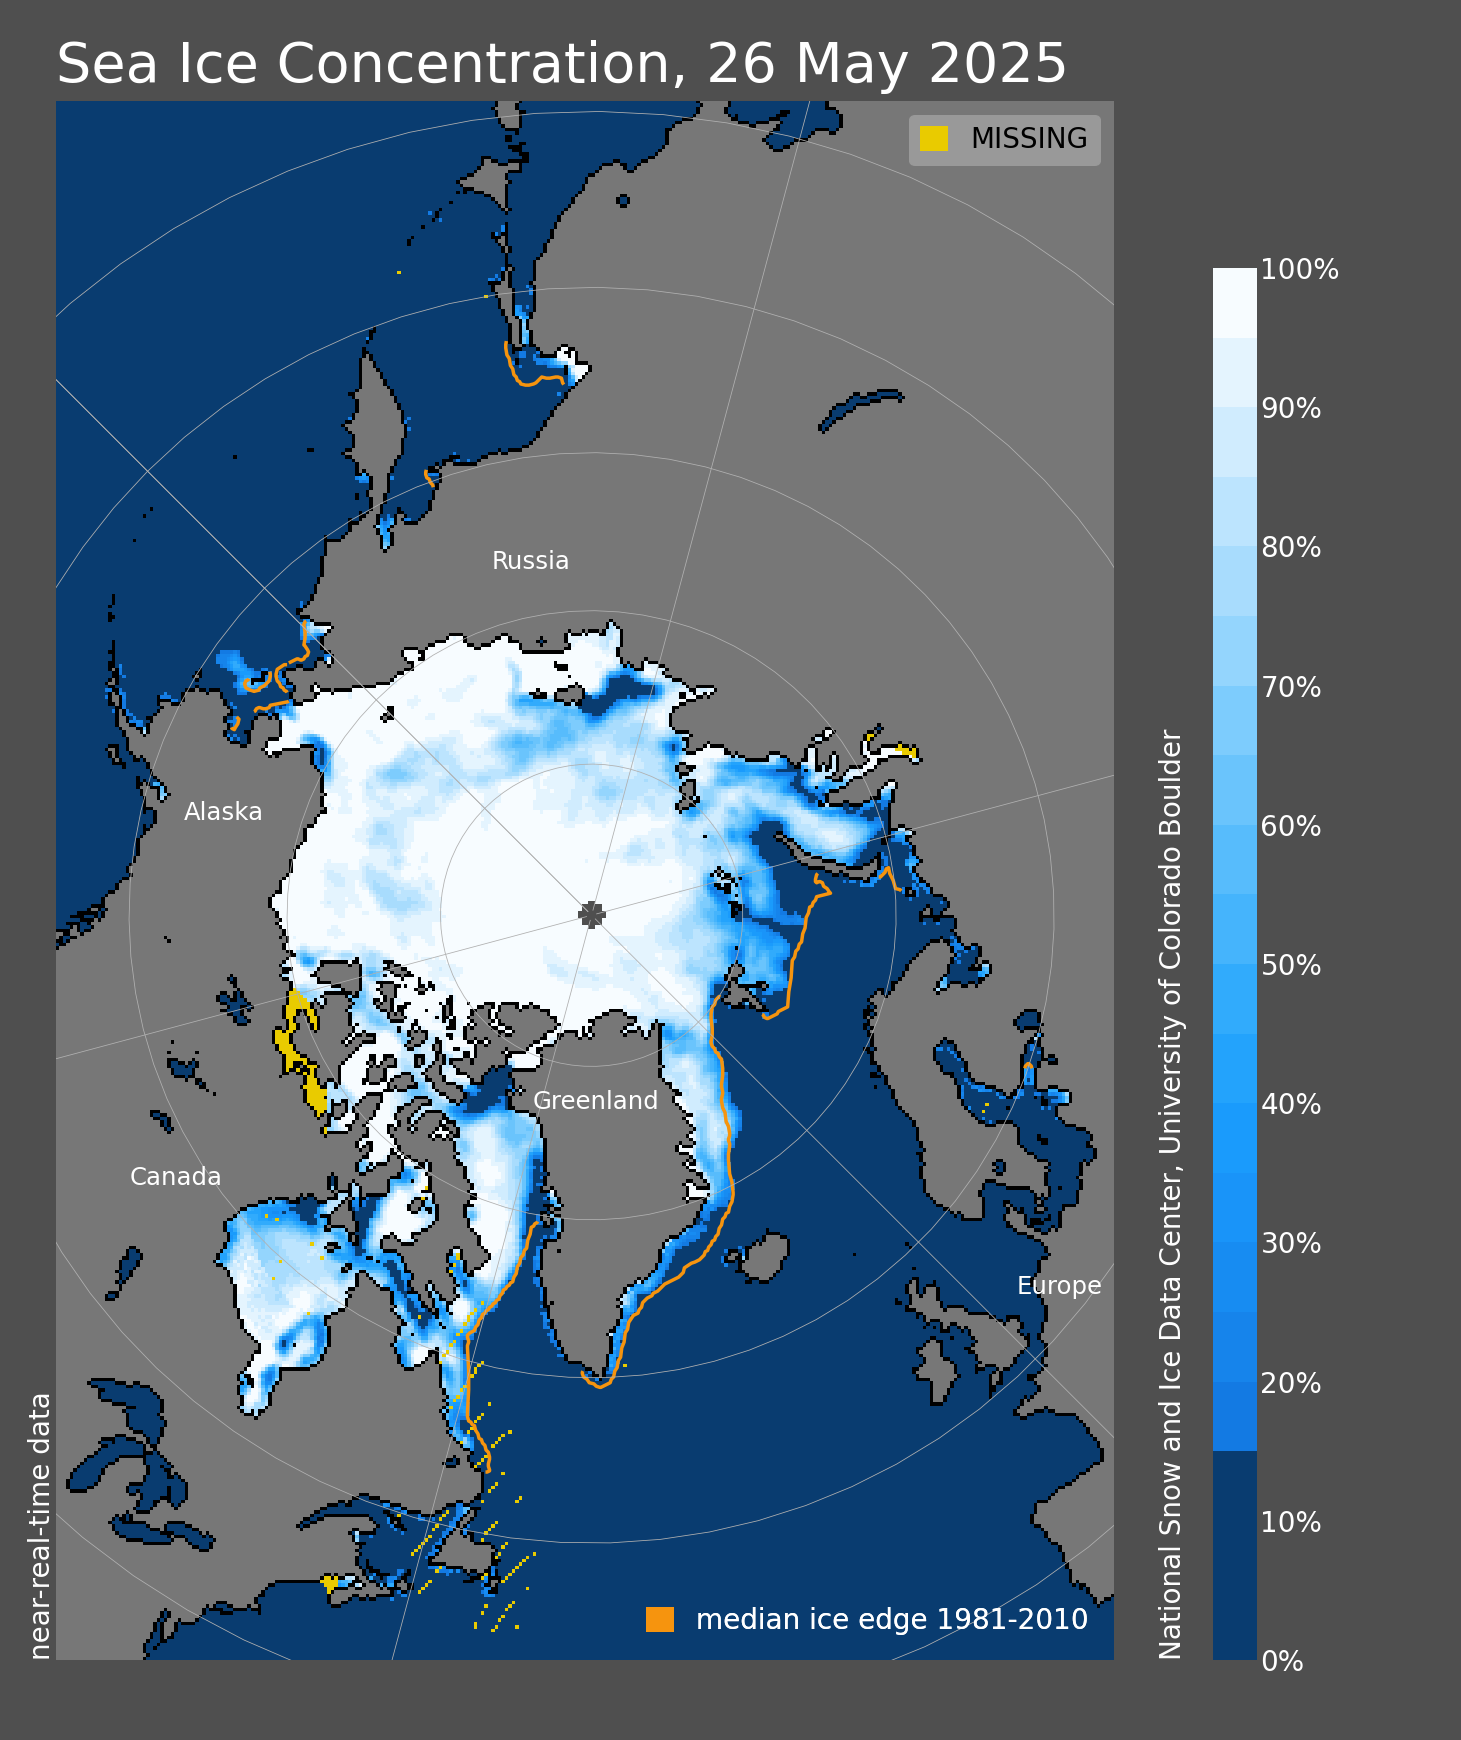 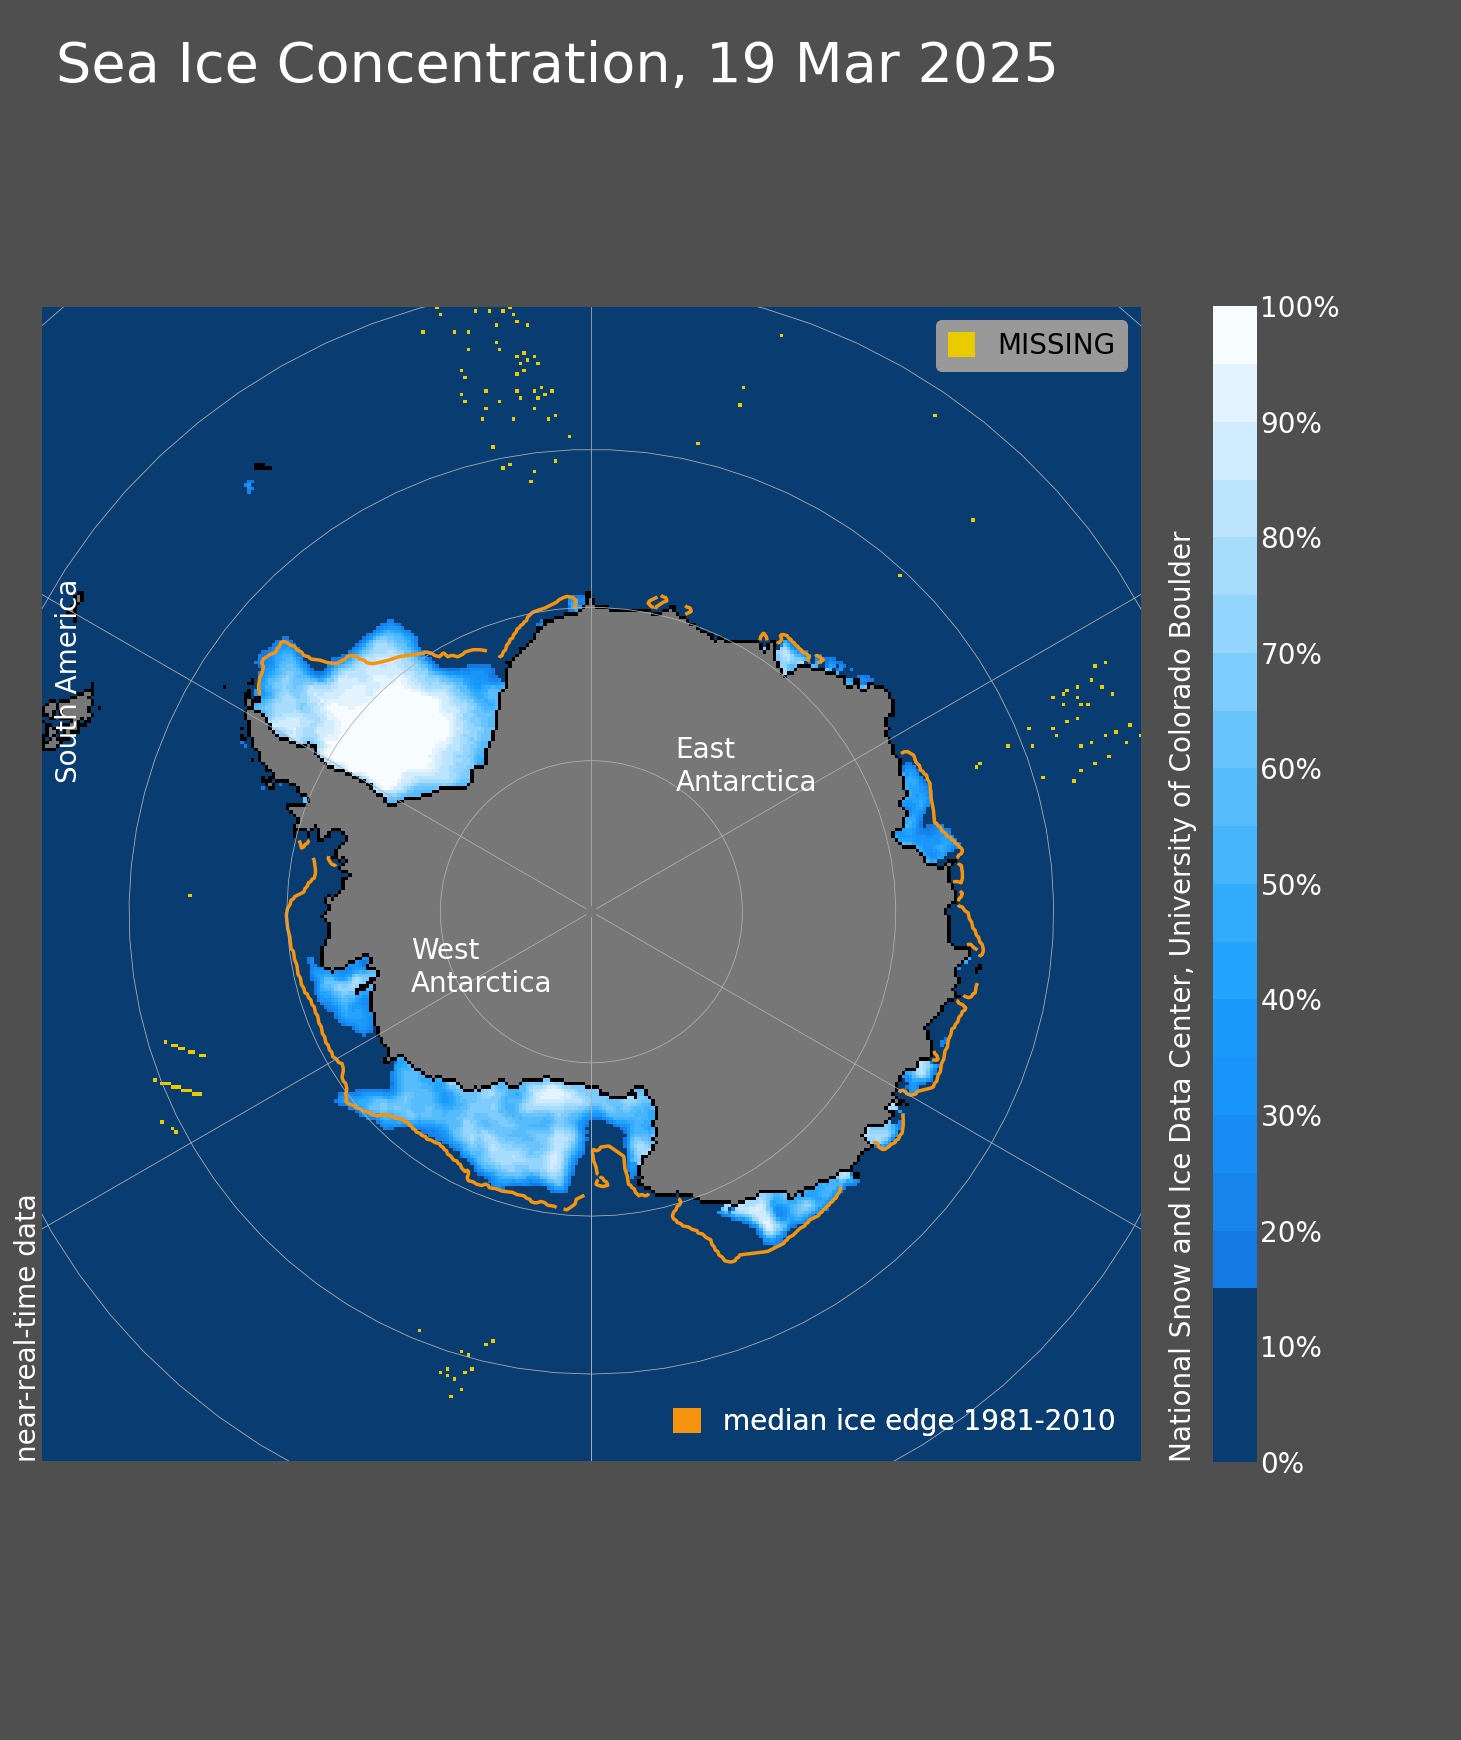 | Daily Sea Ice Concentration
These images show the percentage of ice cover for each roughly 25-kilometer-square data cell that is more than 15 percent covered by ice on a given day. The daily images may be missing data (missing data appears as dark grey dots or areas). The area around the North Pole that is not imaged by the satellite is excluded from the area because there is no way to know what the concentration is within this area.
See documentation for details.
|